- Bokeh 教程
- Bokeh - 主頁
- Bokeh - 簡介
- Bokeh - 環境設定
- Bokeh - 入門
- Bokeh - Jupyter 筆記本
- Bokeh - 基礎概念
- Bokeh - 帶有字形的繪圖
- Bokeh - 區域圖
- Bokeh - 圓形字形
- Bokeh - 矩形、橢圓和多邊形
- Bokeh - 扇形和弧形
- Bokeh - 特殊曲線
- Bokeh - 設定範圍
- Bokeh - 座標軸
- Bokeh - 註釋和圖例
- Bokeh - Pandas
- Bokeh - ColumnDataSource
- Bokeh - 過濾資料
- Bokeh - 佈局
- Bokeh - 繪圖工具
- Bokeh - 設定視覺屬性的樣式
- Bokeh - 自定義圖例
- Bokeh - 新增小工具
- Bokeh - 伺服器
- Bokeh - 使用 Bokeh 子命令
- Bokeh - 匯出繪圖
- Bokeh - 嵌入繪圖和應用
- Bokeh - 擴充套件 Bokeh
- Bokeh - WebGL
- Bokeh - 使用 JavaScript 進行開發
- Bokeh 有用資源
- Bokeh - 快速指南
- Bokeh - 有用資源
- Bokeh - 討論
Bokeh - 註釋和圖例
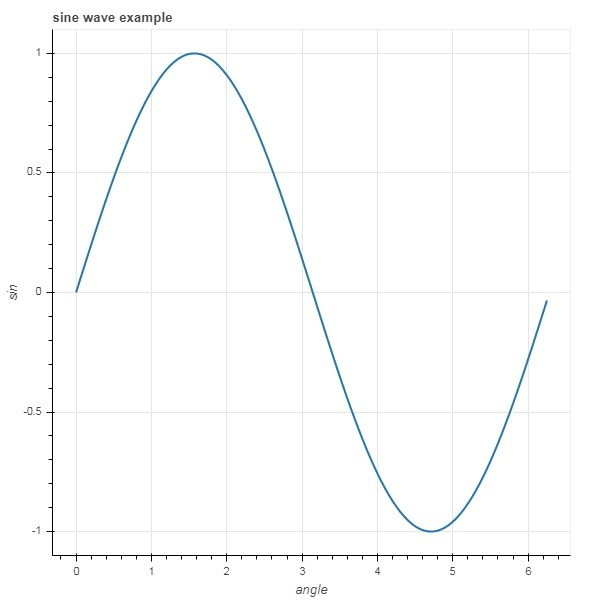
註釋是新增到圖表中的說明性文字。可以透過指定繪圖示題、x 和 y 軸的標籤以及在繪圖區域中的任意位置插入文字標籤來對 Bokeh 繪圖進行註釋。
繪圖示題及 x 和 y 軸標籤可以在 Figure 建構函式中自身提供。
fig = figure(title, x_axis_label, y_axis_label)
在以下繪圖中,這些屬性設定如下 −
from bokeh.plotting import figure, output_file, show
import numpy as np
import math
x = np.arange(0, math.pi*2, 0.05)
y = np.sin(x)
fig = figure(title = "sine wave example", x_axis_label = 'angle', y_axis_label = 'sin')
fig.line(x, y,line_width = 2)
show(p)
輸出
還可以透過向 figure 物件的相應屬性分配相應的字串值來指定標題文字和軸標籤。
fig.title.text = "sine wave example"
fig.xaxis.axis_label = 'angle'
fig.yaxis.axis_label = 'sin'
也可以指定標題的位置、對齊方式、字型和顏色。
fig.title.align = "right"
fig.title.text_color = "orange"
fig.title.text_font_size = "25px"
fig.title.background_fill_color = "blue"
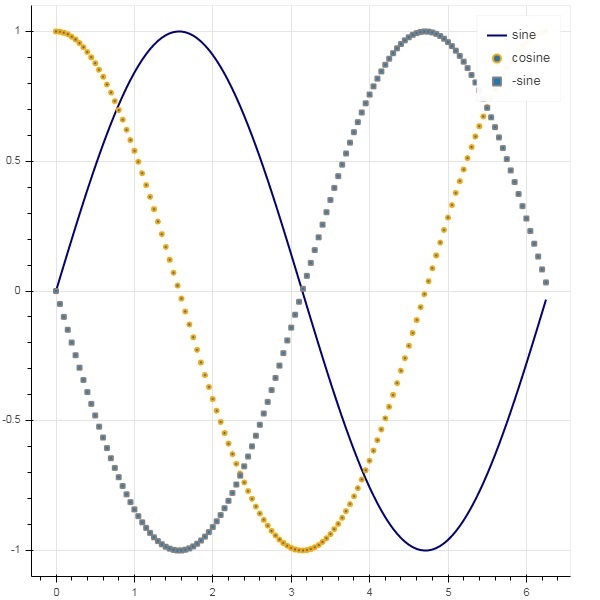
向繪圖 figure 新增圖例非常容易。我們必須使用任何字形方法的 legend 屬性。
下面我們有三個具有三個不同圖例的繪圖曲線 −
from bokeh.plotting import figure, output_file, show
import numpy as np
import math
x = np.arange(0, math.pi*2, 0.05)
fig = figure()
fig.line(x, np.sin(x),line_width = 2, line_color = 'navy', legend = 'sine')
fig.circle(x,np.cos(x), line_width = 2, line_color = 'orange', legend = 'cosine')
fig.square(x,-np.sin(x),line_width = 2, line_color = 'grey', legend = '-sine')
show(fig)
輸出
廣告