- Bokeh 教程
- Bokeh - 首頁
- Bokeh - 簡介
- Bokeh - 環境設定
- Bokeh - 開始使用
- Bokeh - Jupyter Notebook
- Bokeh - 基本概念
- Bokeh - 使用 Glyphs 繪製圖形
- Bokeh - 面積圖
- Bokeh - 圓形 Glyphs
- Bokeh - 矩形、橢圓和多邊形
- Bokeh - 扇形和弧形
- Bokeh - 特殊曲線
- Bokeh - 設定範圍
- Bokeh - 座標軸
- Bokeh - 註釋和圖例
- Bokeh - Pandas
- Bokeh - ColumnDataSource
- Bokeh - 資料過濾
- Bokeh - 佈局
- Bokeh - 繪圖工具
- Bokeh - 樣式化視覺屬性
- Bokeh - 自定義圖例
- Bokeh - 新增部件
- Bokeh - 伺服器
- Bokeh - 使用 Bokeh 子命令
- Bokeh - 匯出圖形
- Bokeh - 嵌入圖形和應用
- Bokeh - 擴充套件 Bokeh
- Bokeh - WebGL
- Bokeh - 使用 JavaScript 進行開發
- Bokeh 有用資源
- Bokeh - 快速指南
- Bokeh - 有用資源
- Bokeh - 討論
Bokeh - 新增部件
bokeh.models.widgets 模組包含類似於 HTML 表單元素的 GUI 物件的定義,例如按鈕、滑塊、複選框、單選按鈕等。這些控制元件為繪圖提供互動式介面。可以透過在相應的事件上執行自定義 JavaScript 函式來執行諸如修改繪圖資料、更改繪圖引數等處理。
Bokeh 允許使用兩種方法定義回撥功能:
使用**CustomJS 回撥**,以便互動性可以在獨立的 HTML 文件中工作。
使用**Bokeh 伺服器**並設定事件處理程式。
在本節中,我們將瞭解如何新增 Bokeh 部件並分配 JavaScript 回撥。
按鈕
此部件是一個可點選的按鈕,通常用於呼叫使用者定義的回撥處理程式。建構函式採用以下引數:
Button(label, icon, callback)
label 引數是用作按鈕標題的字串,callback 是單擊時要呼叫的自定義 JavaScript 函式。
在下面的示例中,繪圖和按鈕部件顯示在 Column 佈局中。繪圖本身在 x 和 y 資料序列之間呈現一條線型 Glyph。
使用**CustomJS() 函式**定義了一個名為“callback”的自定義 JavaScript 函式。它以 cb_obj 變數的形式接收觸發回撥的物件(在本例中為按鈕)的引用。
此函式會更改源 ColumnDataSource 資料,並最終在此源資料中發出此更新。
from bokeh.layouts import column
from bokeh.models import CustomJS, ColumnDataSource
from bokeh.plotting import Figure, output_file, show
from bokeh.models.widgets import Button

x = [x*0.05 for x in range(0, 200)]
y = x

source = ColumnDataSource(data=dict(x=x, y=y))
plot = Figure(plot_width=400, plot_height=400)
plot.line('x', 'y', source=source, line_width=3, line_alpha=0.6)

callback = CustomJS(args=dict(source=source), code="""
   var data = source.data;
   x = data['x']
   y = data['y']
   for (i = 0; i < x.length; i++) {
      y[i] = Math.pow(x[i], 4)
   }
   source.change.emit();
""")

btn = Button(label="click here", callback=callback, name="1")

layout = column(btn , plot)
show(layout)
輸出(初始)
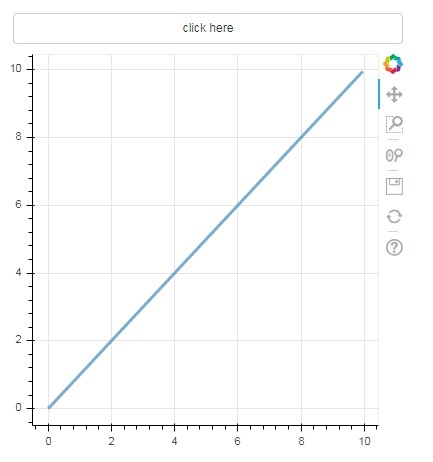
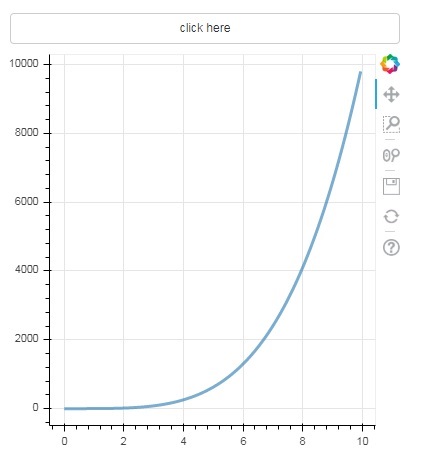
單擊繪圖頂部的按鈕,檢視更新後的繪圖圖形,如下所示:
輸出(點選後)
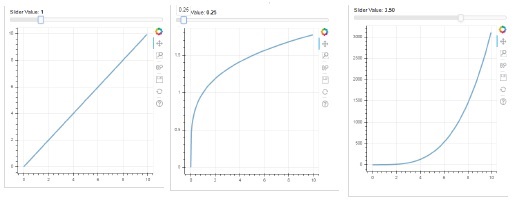
滑塊
藉助滑塊控制元件,可以選擇分配給它的 start 和 end 屬性之間的數字。
Slider(start, end, step, value)
在下面的示例中,我們在滑塊的 on_change 事件上註冊了一個回撥函式。滑塊的瞬時數值以 cb_obj.value 的形式提供給處理程式,用於修改 ColumnDatasource 資料。當您滑動位置時,繪圖圖形會持續更新。
from bokeh.layouts import column
from bokeh.models import CustomJS, ColumnDataSource
from bokeh.plotting import Figure, output_file, show
from bokeh.models.widgets import Slider

x = [x*0.05 for x in range(0, 200)]
y = x

source = ColumnDataSource(data=dict(x=x, y=y))
plot = Figure(plot_width=400, plot_height=400)
plot.line('x', 'y', source=source, line_width=3, line_alpha=0.6)

handler = CustomJS(args=dict(source=source), code="""
   var data = source.data;
   var f = cb_obj.value
   var x = data['x']
   var y = data['y']
   for (var i = 0; i < x.length; i++) {
      y[i] = Math.pow(x[i], f)
   }
   source.change.emit();
""")

slider = Slider(start=0.0, end=5, value=1, step=.25, title="Slider Value")

slider.js_on_change('value', handler)
layout = column(slider, plot)
show(layout)
輸出
單選組
此部件呈現一組互斥的切換按鈕,在標題左側顯示圓形按鈕。
RadioGroup(labels, active)
其中,labels 是標題列表,active 是所選項的索引。
選擇
此部件是一個簡單的字串專案下拉列表,可以選擇其中一個。選定的字串顯示在頂部視窗,它是 value 引數。
Select(options, value)
下拉選單中的字串元素列表以 options 列表物件的形式給出。
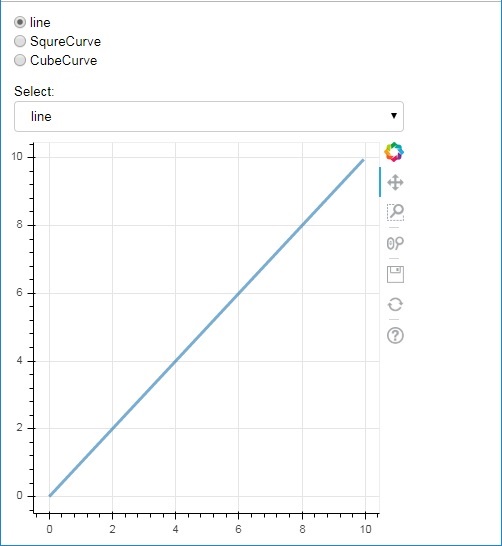
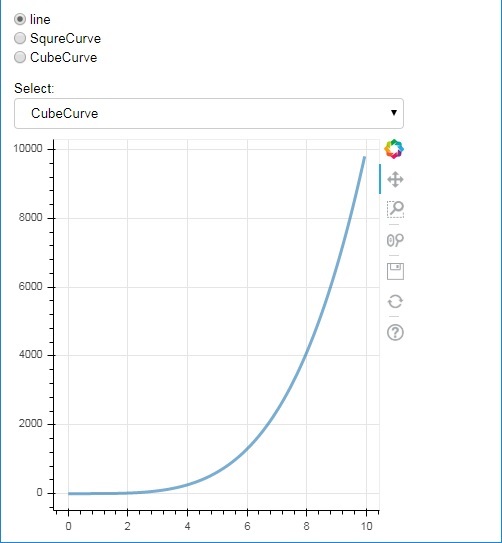
以下是單選按鈕和選擇部件的組合示例,兩者都提供了 x 和 y 資料序列之間三種不同的關係。**RadioGroup** 和 **Select 部件**透過 on_change() 方法與其各自的處理程式註冊。
from bokeh.layouts import column
from bokeh.models import CustomJS, ColumnDataSource
from bokeh.plotting import Figure, output_file, show
from bokeh.models.widgets import RadioGroup, Select

x = [x*0.05 for x in range(0, 200)]
y = x

source = ColumnDataSource(data=dict(x=x, y=y))

plot = Figure(plot_width=400, plot_height=400)
plot.line('x', 'y', source=source, line_width=3, line_alpha=0.6)

radiohandler = CustomJS(args=dict(source=source), code="""
   var data = source.data;
   console.log('Tap event occurred at x-position: ' + cb_obj.active);
   //plot.title.text=cb_obj.value;
   x = data['x']
   y = data['y']
   if (cb_obj.active==0){
      for (i = 0; i < x.length; i++) {
         y[i] = x[i];
      }
   }
   if (cb_obj.active==1){
      for (i = 0; i < x.length; i++) {
         y[i] = Math.pow(x[i], 2)
      }
   }
   if (cb_obj.active==2){
      for (i = 0; i < x.length; i++) {
         y[i] = Math.pow(x[i], 4)
      }
   }
   source.change.emit();
""")

selecthandler = CustomJS(args=dict(source=source), code="""
   var data = source.data;
   console.log('Tap event occurred at x-position: ' + cb_obj.value);
   //plot.title.text=cb_obj.value;
   x = data['x']
   y = data['y']
   if (cb_obj.value=="line"){
      for (i = 0; i < x.length; i++) {
         y[i] = x[i];
      }
   }
   if (cb_obj.value=="SquareCurve"){
      for (i = 0; i < x.length; i++) {
         y[i] = Math.pow(x[i], 2)
      }
   }
   if (cb_obj.value=="CubeCurve"){
      for (i = 0; i < x.length; i++) {
         y[i] = Math.pow(x[i], 4)
      }
   }
   source.change.emit();
""")

radio = RadioGroup(
   labels=["line", "SqureCurve", "CubeCurve"], active=0)
radio.js_on_change('active', radiohandler)
select = Select(title="Select:", value='line', options=["line", "SquareCurve", "CubeCurve"])
select.js_on_change('value', selecthandler)

layout = column(radio, select, plot)
show(layout)
輸出
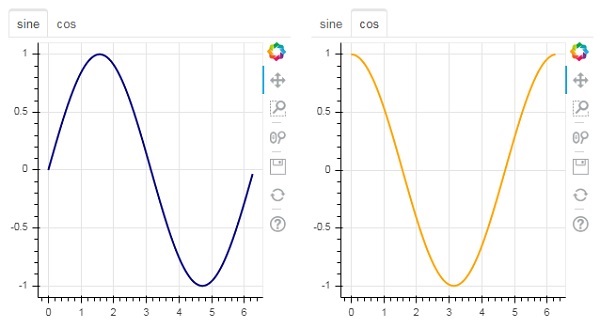
選項卡部件
就像在瀏覽器中一樣,每個選項卡都可以顯示不同的網頁,選項卡部件是 Bokeh 模型,為每個圖形提供不同的檢視。在下面的示例中,正弦曲線和餘弦曲線的兩個繪圖圖形在兩個不同的選項卡中呈現:
from bokeh.plotting import figure, output_file, show
from bokeh.models import Panel, Tabs
import numpy as np
import math
x=np.arange(0, math.pi*2, 0.05)
fig1=figure(plot_width=300, plot_height=300)

fig1.line(x, np.sin(x),line_width=2, line_color='navy')

tab1 = Panel(child=fig1, title="sine")
fig2=figure(plot_width=300, plot_height=300)
fig2.line(x,np.cos(x), line_width=2, line_color='orange')
tab2 = Panel(child=fig2, title="cos")

tabs = Tabs(tabs=[ tab1, tab2 ])

show(tabs)
輸出