- Bokeh 教程
- Bokeh - 首頁
- Bokeh - 簡介
- Bokeh - 環境設定
- Bokeh - 開始
- Bokeh - Jupyter Notebook
- Bokeh - 基本概念
- Bokeh - 使用 Glyphs 繪製圖形
- Bokeh - 面積圖
- Bokeh - 圓形 Glyphs
- Bokeh - 矩形、橢圓和多邊形
- Bokeh - 扇形和弧形
- Bokeh - 特殊曲線
- Bokeh - 設定範圍
- Bokeh - 座標軸
- Bokeh - 註釋和圖例
- Bokeh - Pandas
- Bokeh - ColumnDataSource
- Bokeh - 資料過濾
- Bokeh - 佈局
- Bokeh - 繪圖工具
- Bokeh - 樣式視覺屬性
- Bokeh - 自定義圖例
- Bokeh - 新增小部件
- Bokeh - 伺服器
- Bokeh - 使用 Bokeh 子命令
- Bokeh - 匯出繪圖
- Bokeh - 嵌入繪圖和應用程式
- Bokeh - 擴充套件 Bokeh
- Bokeh - WebGL
- Bokeh - 使用 JavaScript 開發
- Bokeh 有用資源
- Bokeh - 快速指南
- Bokeh - 有用資源
- Bokeh - 討論
Bokeh - 佈局
Bokeh 視覺化可以以不同的佈局選項進行適當的排列。這些佈局以及大小模式使繪圖和小部件可以根據瀏覽器視窗的大小自動調整大小。為了保持一致的外觀,佈局中的所有專案必須具有相同的大小模式。小部件(按鈕、選單等)放在單獨的小部件框中,而不是繪圖圖形中。
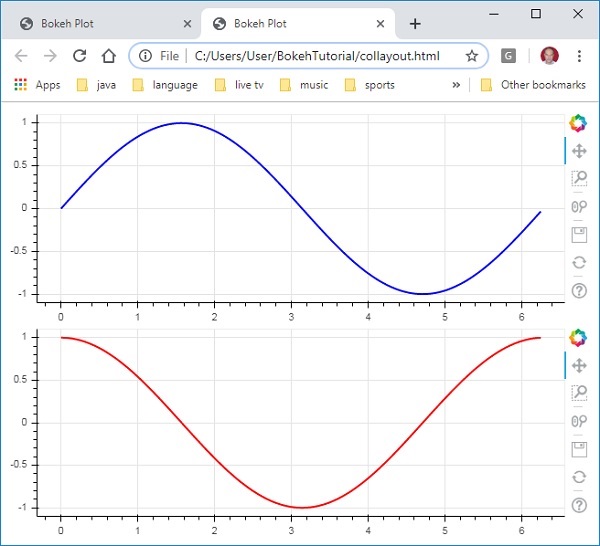
第一種型別的佈局是列布局,它垂直顯示繪圖圖形。column() 函式定義在bokeh.layouts模組中,並採用以下簽名:
from bokeh.layouts import column
col = column(children, sizing_mode)
children − 繪圖和/或小部件的列表。
sizing_mode − 確定佈局中專案的調整大小方式。可能的值為“fixed”、“stretch_both”、“scale_width”、“scale_height”、“scale_both”。預設為“fixed”。
以下程式碼生成兩個 Bokeh 圖形並將它們放在列布局中,以便垂直顯示它們。每個圖形中都顯示了表示 x 和 y 資料系列之間正弦和餘弦關係的線型圖。
from bokeh.plotting import figure, output_file, show
from bokeh.layouts import column
import numpy as np
import math
x = np.arange(0, math.pi*2, 0.05)
y1 = np.sin(x)
y2 = np.cos(x)
fig1 = figure(plot_width = 200, plot_height = 200)
fig1.line(x, y1,line_width = 2, line_color = 'blue')
fig2 = figure(plot_width = 200, plot_height = 200)
fig2.line(x, y2,line_width = 2, line_color = 'red')
c = column(children = [fig1, fig2], sizing_mode = 'stretch_both')
show(c)
輸出
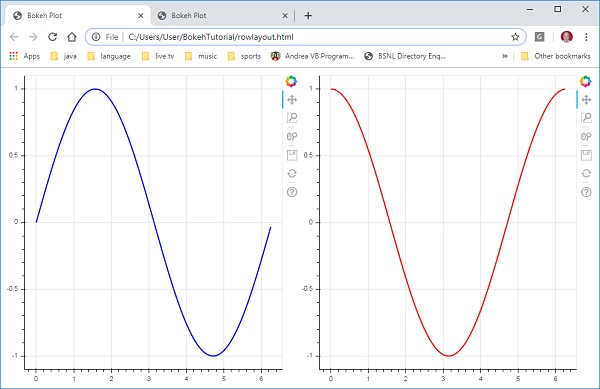
類似地,行佈局水平排列繪圖,為此使用bokeh.layouts模組中定義的row() 函式。正如你所想,它也接受兩個引數(類似於column() 函式)——children 和 sizing_mode。
上面圖表中垂直顯示的正弦和餘弦曲線現在使用以下程式碼水平顯示在行佈局中
from bokeh.plotting import figure, output_file, show
from bokeh.layouts import row
import numpy as np
import math
x = np.arange(0, math.pi*2, 0.05)
y1 = np.sin(x)
y2 = np.cos(x)
fig1 = figure(plot_width = 200, plot_height = 200)
fig1.line(x, y1,line_width = 2, line_color = 'blue')
fig2 = figure(plot_width = 200, plot_height = 200)
fig2.line(x, y2,line_width = 2, line_color = 'red')
r = row(children = [fig1, fig2], sizing_mode = 'stretch_both')
show(r)
輸出
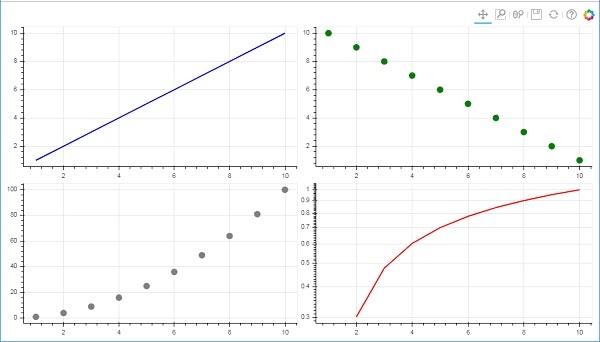
Bokeh 包還具有網格佈局。它在一個二維網格的行和列中容納多個繪圖圖形(以及小部件)。bokeh.layouts模組中的gridplot() 函式返回一個網格和一個單一的統一工具欄,可以使用 toolbar_location 屬性對其進行定位。
這與行或列布局不同,在行或列布局中,每個繪圖顯示其自己的工具欄。grid() 函式也使用 children 和 sizing_mode 引數,其中 children 是一個列表的列表。確保每個子列表的維度相同。
在以下程式碼中,四個不同的 x 和 y 資料系列之間的關係繪製在由兩行兩列組成的網格中。
from bokeh.plotting import figure, output_file, show
from bokeh.layouts import gridplot
import math
x = list(range(1,11))

y1 = x
y2 =[11-i for i in x]
y3 = [i*i for i in x]
y4 = [math.log10(i) for i in x]

fig1 = figure(plot_width = 200, plot_height = 200)
fig1.line(x, y1,line_width = 2, line_color = 'blue')
fig2 = figure(plot_width = 200, plot_height = 200)
fig2.circle(x, y2,size = 10, color = 'green')
fig3 = figure(plot_width = 200, plot_height = 200)
fig3.circle(x,y3, size = 10, color = 'grey')
fig4 = figure(plot_width = 200, plot_height = 200, y_axis_type = 'log')
fig4.line(x,y4, line_width = 2, line_color = 'red')
grid = gridplot(children = [[fig1, fig2], [fig3,fig4]], sizing_mode = 'stretch_both')
show(grid)
輸出