- Bokeh 教程
- Bokeh - 首頁
- Bokeh - 簡介
- Bokeh - 環境設定
- Bokeh - 入門
- Bokeh - Jupyter Notebook
- Bokeh - 基本概念
- Bokeh - 使用 Glyph 繪製圖形
- Bokeh - 面積圖
- Bokeh - 圓形 Glyph
- Bokeh - 矩形、橢圓和多邊形
- Bokeh - 扇形和弧形
- Bokeh - 專用曲線
- Bokeh - 設定範圍
- Bokeh - 座標軸
- Bokeh - 註釋和圖例
- Bokeh - Pandas
- Bokeh - ColumnDataSource
- Bokeh - 資料過濾
- Bokeh - 佈局
- Bokeh - 圖表工具
- Bokeh - 樣式化視覺屬性
- Bokeh - 自定義圖例
- Bokeh - 新增小部件
- Bokeh - 伺服器
- Bokeh - 使用 Bokeh 子命令
- Bokeh - 匯出圖表
- Bokeh - 嵌入圖表和應用程式
- Bokeh - 擴充套件 Bokeh
- Bokeh - WebGL
- Bokeh - 使用 JavaScript 開發
- Bokeh 有用資源
- Bokeh - 快速指南
- Bokeh - 有用資源
- Bokeh - 討論
Bokeh - 面積圖
面積圖是在共享共同索引的兩個序列之間填充的區域。Bokeh 的 Figure 類有兩個如下方法:
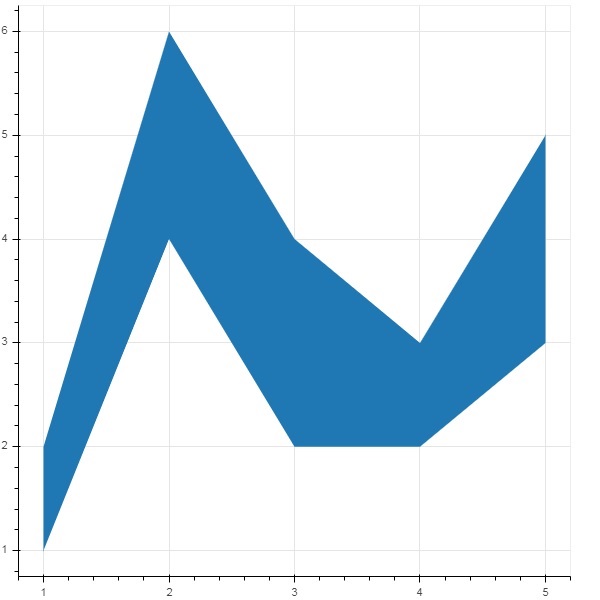
varea()
varea() 方法的輸出是一個垂直方向的區域,它具有一個 x 座標陣列和兩個 y 座標陣列 y1 和 y2,它們將填充在兩者之間。
| 1 | x | 區域點的 x 座標。 |
| 2 | y1 | 區域一側點的 y 座標。 |
| 3 | y2 | 區域另一側點的 y 座標。 |
示例
from bokeh.plotting import figure, output_file, show
fig = figure()
x = [1, 2, 3, 4, 5]
y1 = [2, 6, 4, 3, 5]
y2 = [1, 4, 2, 2, 3]
fig.varea(x = x,y1 = y1,y2 = y2)
output_file('area.html')
show(fig)
輸出
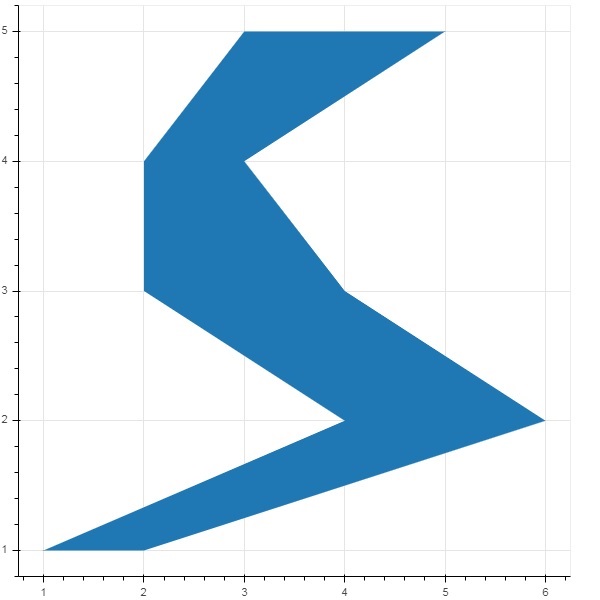
harea()
另一方面,harea() 方法需要 x1、x2 和 y 引數。
| 1 | x1 | 區域一側點的 x 座標。 |
| 2 | x2 | 區域另一側點的 x 座標。 |
| 3 | y | 區域點的 y 座標。 |
示例
from bokeh.plotting import figure, output_file, show
fig = figure()
y = [1, 2, 3, 4, 5]
x1 = [2, 6, 4, 3, 5]
x2 = [1, 4, 2, 2, 3]
fig.harea(x1 = x1,x2 = x2,y = y)
output_file('area.html')
show(fig)
輸出
廣告