- 大資料分析教程
- 大資料分析 - 首頁
- 大資料分析 - 概述
- 大資料分析 - 特徵
- 大資料分析 - 資料生命週期
- 大資料分析 - 架構
- 大資料分析 - 方法論
- 大資料分析 - 核心交付成果
- 大資料採用與規劃考慮因素
- 大資料分析 - 關鍵利益相關者
- 大資料分析 - 資料分析師
- 大資料分析 - 資料科學家
- 大資料分析有用資源
- 大資料分析 - 快速指南
- 大資料分析 - 資源
- 大資料分析 - 討論
大資料分析 - K均值聚類
k均值聚類旨在將n個觀測值劃分為k個聚類,其中每個觀測值屬於具有最近均值的聚類,該均值作為聚類的原型。這導致資料空間被劃分為Voronoi單元。
給定一組觀測值(x1, x2, …, xn),其中每個觀測值都是一個d維實數向量,k均值聚類旨在將n個觀測值劃分為k組G = {G1, G2, …, Gk},以最小化如下定義的聚類內平方和 (WCSS):
$$argmin \: \sum_{i = 1}^{k} \sum_{x \in S_{i}}\parallel x - \mu_{i}\parallel ^2$$
後面的公式顯示了為了找到k均值聚類中的最佳原型而最小化的目標函式。該公式的直覺是我們希望找到彼此不同的組,並且每個組的每個成員都應該與每個聚類的其他成員相似。
以下示例演示瞭如何在R中執行k均值聚類演算法。
library(ggplot2)
# Prepare Data
data = mtcars
# We need to scale the data to have zero mean and unit variance
data <- scale(data)
# Determine number of clusters
wss <- (nrow(data)-1)*sum(apply(data,2,var))
for (i in 2:dim(data)[2]) {
wss[i] <- sum(kmeans(data, centers = i)$withinss)
}
# Plot the clusters
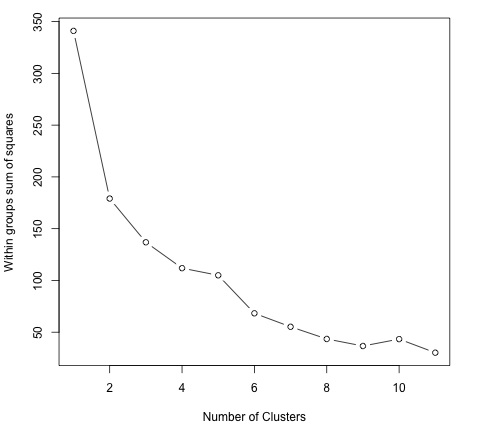
plot(1:dim(data)[2], wss, type = "b", xlab = "Number of Clusters",
ylab = "Within groups sum of squares")
為了找到K的一個好值,我們可以繪製不同K值的組內平方和。該指標通常隨著新增更多組而減少,我們希望找到組內平方和的減少開始緩慢減少的點。在圖中,該值最好由K = 6表示。
現在K的值已經確定,需要使用該值執行演算法。
# K-Means Cluster Analysis
fit <- kmeans(data, 5) # 5 cluster solution

# get cluster means
aggregate(data,by = list(fit$cluster),FUN = mean)

# append cluster assignment
data <- data.frame(data, fit$cluster)
廣告