時間序列 - 移動平均
對於平穩時間序列,移動平均模型將時間 't' 處的變數值視為前 'q' 個時間步長的殘差誤差的線性函式。透過比較時間 't' 處的值和之前值的移動平均值來計算殘差誤差。
在數學上可以寫成 -
$$y_{t} = c\:+\:\epsilon_{t}\:+\:\theta_{1}\:\epsilon_{t-1}\:+\:\theta_{2}\:\epsilon_{t-2}\:+\:...+:\theta_{q}\:\epsilon_{t-q}\:$$
其中'q' 是移動平均趨勢引數
$\epsilon_{t}$ 是白噪聲,並且
$\epsilon_{t-1}, \epsilon_{t-2}...\epsilon_{t-q}$ 是前一時期的誤差項。
可以使用多種方法來校準 'q' 的值。一種尋找合適的 'q' 值的方法是繪製偏自相關圖。
偏自相關圖顯示變數與其自身在早期時間步長處的關係,移除了間接相關性,這與自相關圖不同,自相關圖顯示直接相關性和間接相關性,讓我們看看對於我們資料的 'temperature' 變數它看起來如何。
顯示 PACP
In [143]
from statsmodels.graphics.tsaplots import plot_pacf

plot_pacf(train, lags = 100)
plt.show()
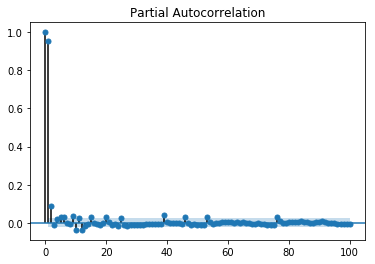
偏自相關與相關圖以相同的方式進行讀取。
廣告