時間序列 - 資料處理與視覺化
時間序列是在等距時間間隔內索引的一系列觀察值。因此,在任何時間序列中都應保持順序和連續性。
我們將使用的資料集是一個多變數時間序列,包含一個義大利汙染嚴重的城市大約一年的空氣質量小時資料。該資料集可以從以下連結下載:https://archive.ics.uci.edu/ml/datasets/air+quality。
有必要確保:
時間序列是等距的,並且
其中沒有冗餘值或缺失值。
如果時間序列不連續,我們可以對其進行上取樣或下采樣。
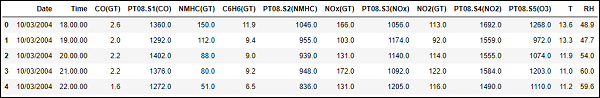
顯示 df.head()
In [122]
import pandas
In [123]
df = pandas.read_csv("AirQualityUCI.csv", sep = ";", decimal = ",")
df = df.iloc[ : , 0:14]
In [124]
len(df)
Out[124]
9471
In [125]
df.head()
Out[125]
為了預處理時間序列,我們確保資料集中沒有 NaN(NULL)值;如果有,我們可以用 0 或平均值或前一個或後一個值替換它們。替換是優於刪除的首選方法,以便保持時間序列的連續性。但是,在我們的資料集中,最後幾個值似乎為 NULL,因此刪除不會影響連續性。
刪除 NaN(非數字)
In [126]
df.isna().sum()
Out[126]:
Date             114
Time             114
CO(GT)           114
PT08.S1(CO)      114
NMHC(GT)         114
C6H6(GT)         114
PT08.S2(NMHC)    114
NOx(GT)          114
PT08.S3(NOx)     114
NO2(GT)          114
PT08.S4(NO2)     114
PT08.S5(O3)      114
T                114
RH               114
dtype: int64
In [127]
df = df[df['Date'].notnull()]
In [128]
df.isna().sum()
Out[128]
Date             0
Time             0
CO(GT)           0
PT08.S1(CO)      0
NMHC(GT)         0
C6H6(GT)         0
PT08.S2(NMHC)    0
NOx(GT)          0
PT08.S3(NOx)     0
NO2(GT)          0
PT08.S4(NO2)     0
PT08.S5(O3)      0
T                0
RH               0
dtype: int64
時間序列通常以折線圖的形式繪製在時間軸上。為此,我們現在將合併日期和時間列,並將其從字串轉換為日期時間物件。這可以透過使用 datetime 庫來實現。
轉換為日期時間物件
In [129]
df['DateTime'] = (df.Date) + ' ' + (df.Time)
print (type(df.DateTime[0]))
<class 'str'>
In [130]
import datetime

df.DateTime = df.DateTime.apply(lambda x: datetime.datetime.strptime(x, '%d/%m/%Y %H.%M.%S'))
print (type(df.DateTime[0]))
<class 'pandas._libs.tslibs.timestamps.Timestamp'>
讓我們看看一些變數(如溫度)如何隨著時間的變化而變化。
顯示圖表
In [131]
df.index = df.DateTime
In [132]
import matplotlib.pyplot as plt
plt.plot(df['T'])
Out[132]
[<matplotlib.lines.Line2D at 0x1eaad67f780>]
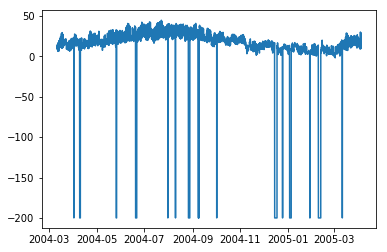
In [208]
plt.plot(df['C6H6(GT)'])
Out[208]
[<matplotlib.lines.Line2D at 0x1eaaeedff28>]
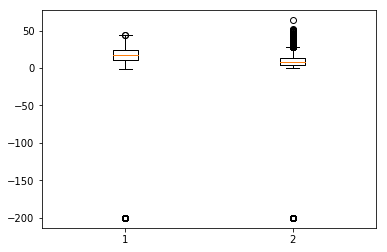
箱線圖是另一種有用的圖表型別,它允許您將大量資料集資訊濃縮到一個圖表中。它顯示了一個或多個變數的平均值、25% 和 75% 分位數以及異常值。當異常值數量少且與平均值相距甚遠時,我們可以透過將其設定為平均值或 75% 分位數來消除異常值。
顯示箱線圖
In [134]
plt.boxplot(df[['T','C6H6(GT)']].values)
Out[134]
{'whiskers': [<matplotlib.lines.Line2D at 0x1eaac16de80>,
   <matplotlib.lines.Line2D at 0x1eaac16d908>,
   <matplotlib.lines.Line2D at 0x1eaac177a58>,
   <matplotlib.lines.Line2D at 0x1eaac177cf8>],
   'caps': [<matplotlib.lines.Line2D at 0x1eaac16d2b0>,
   <matplotlib.lines.Line2D at 0x1eaac16d588>,
   <matplotlib.lines.Line2D at 0x1eaac1a69e8>,
   <matplotlib.lines.Line2D at 0x1eaac1a64a8>],
   'boxes': [<matplotlib.lines.Line2D at 0x1eaac16dc50>,
   <matplotlib.lines.Line2D at 0x1eaac1779b0>],
   'medians': [<matplotlib.lines.Line2D at 0x1eaac16d4a8>,
   <matplotlib.lines.Line2D at 0x1eaac1a6c50>],
   'fliers': [<matplotlib.lines.Line2D at 0x1eaac177dd8>,
   <matplotlib.lines.Line2D at 0x1eaac1a6c18>],'means': []
}