- SciPy 教程
- SciPy - 主頁
- SciPy - 簡介
- SciPy - 環境設定
- SciPy - 基本功能
- SciPy - 群集
- SciPy - 常量
- SciPy - FFTpack
- SciPy - 整合
- SciPy - 插值
- SciPy - 輸入和輸出
- SciPy - 線性代數
- SciPy - Ndimage
- SciPy - 最佳化
- SciPy - 統計
- SciPy - CSGraph
- SciPy - 空間
- SciPy - ODR
- SciPy - 專用包
- SciPy 有用資源
- SciPy - 參考
- SciPy - 快速指南
- SciPy - 有用資源
- SciPy - 討論
SciPy - ascent() 方法
SciPy ascent() 方法用於獲取 8 位灰度影像派生影像(512*512),用於演示。此方法允許使用者嘗試影像處理技術並應用多種濾波器和變換。
語法
以下是 SciPy ascent() 方法的語法 -
ascent()
引數
此方法不接受任何引數。
返回值
此方法返回一個 2D NumPy 陣列,顯示灰度影像。
示例 1
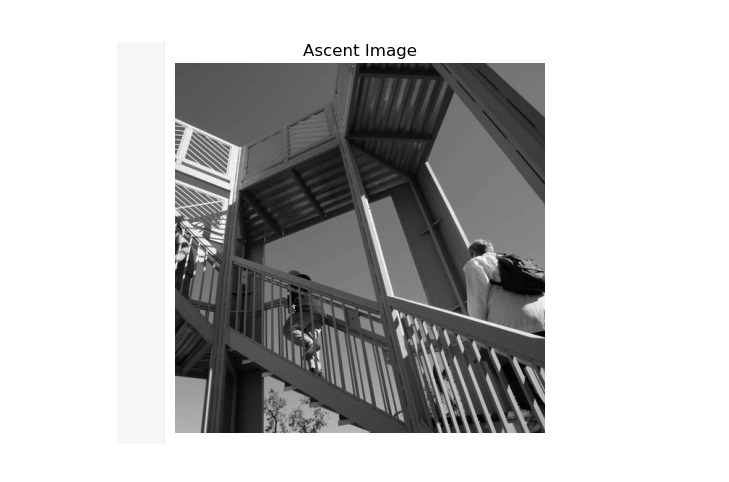
以下是 SciPy ascent() 方法,顯示預先存在的 ascent 影像。
import matplotlib.pyplot as plt
from scipy.misc import ascent

# load the ascent image
image = ascent()

# display the image using matplotlib
plt.imshow(image, cmap='gray')
plt.title('Ascent Image')
plt.axis('off')
plt.show()
輸出
以上程式碼生成以下輸出 -
示例 2
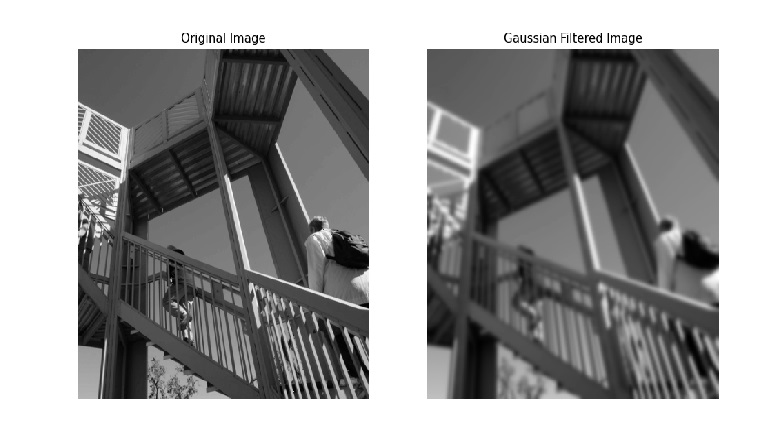
下面的示例區分了原始 ascent 影像和高斯濾波後的影像。
import matplotlib.pyplot as plt
from scipy.ndimage import gaussian_filter
from scipy.misc import ascent

# load the ascent image
image = ascent()

# apply a Gaussian filter to the image
filtered_image = gaussian_filter(image, sigma=3)

# Display the original and filtered images
fig, axes = plt.subplots(1, 2, figsize=(12, 6))
axes[0].imshow(image, cmap='gray')
axes[0].set_title('Original Image')
axes[0].axis('off')

axes[1].imshow(filtered_image, cmap='gray')
axes[1].set_title('Gaussian Filtered Image')
axes[1].axis('off')

plt.show()
輸出
以上程式碼生成以下輸出 -
示例 3
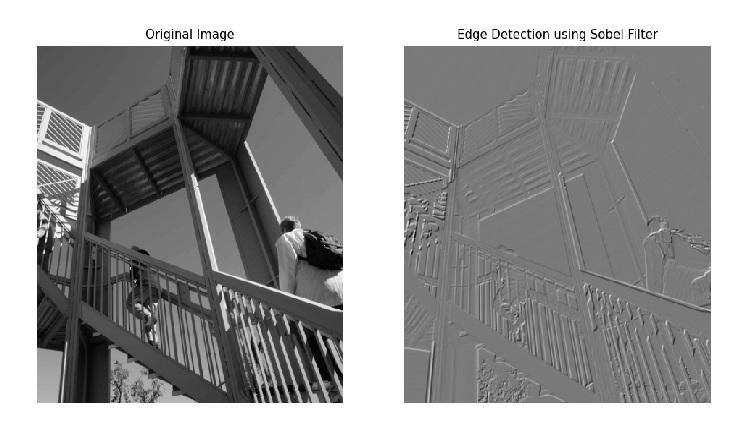
此方法說明了如何使用 Sobel 濾波器對原始 ascent 影像執行邊緣檢測。該濾波器分別在 x 和 y 軸上進行應用,結果作為邊緣檢測影像與原始影像一起生成。
import matplotlib.pyplot as plt
from scipy.ndimage import sobel
from scipy.misc import ascent

# load the ascent image
image = ascent()

# apply the Sobel filter to detect edges
sobel_x = sobel(image, axis=0)
sobel_y = sobel(image, axis=1)
edges = sobel_x + sobel_y

# Display the original image and the edge-detected image
fig, axes = plt.subplots(1, 2, figsize=(12, 6))
axes[0].imshow(image, cmap='gray')
axes[0].set_title('Original Image')
axes[0].axis('off')

axes[1].imshow(edges, cmap='gray')
axes[1].set_title('Edge Detection using Sobel Filter')
axes[1].axis('off')

plt.show()
輸出
以上程式碼生成以下輸出 -
scipy_reference.htm
廣告