- SciPy 教程
- SciPy - 主頁
- SciPy - 簡介
- SciPy - 環境設定
- SciPy - 基本功能
- SciPy - 叢集
- SciPy - 常數
- SciPy - FFTpack
- SciPy - 整合
- SciPy - 插值
- SciPy - 輸入和輸出
- SciPy - 線性代數
- SciPy - 數字影像處理
- SciPy - 最佳化
- SciPy - 統計
- SciPy - 圖論
- SciPy - 空間分析
- SciPy - 正交距離迴歸
- SciPy - 特殊包
- SciPy 有用資源
- SciPy - 參考
- SciPy - 快速指南
- SciPy - 有用資源
- SciPy - 討論
SciPy - value() 方法
SciPy value() 方法屬於 physical_constants 字典,用一個鍵加以索引。 此方法的使用參考了此庫中的最佳化、插值或某些其他功能的上下文。
語法
以下是 SciPy value() 方法的語法 -
value(key)
引數
此方法只接受一個引數 -
- 鍵:定義物理常數名稱的字串。
返回值
此方法返回一個數值,比如浮點數。
示例 1
以下是基本的 SciPy value() 方法,展示了物理常數的結果。
from scipy import constants
result = constants.value('elementary charge')
print("The result of physical constant(elementary charge): ", result)
輸出
上述程式碼產生了以下結果 -
The result of physical constant(elementary charge): 1.602176634e-19
示例 2
下面,此程式展示了 SciPy 最佳化可以透過定製函式返回最小值。 在使用 minimize() 執行最佳化規則後,它將返回一個與屬性 (fun) 關聯的物件 result。
from scipy.optimize import minimize
# define the custom function
def obj(x):
    return x**2 + 5*x + 4

# Perform the optimization
result = minimize(obj, 0)

# The optimized(minimum) value of custom function
opt_value = result.fun

print("The result of optimized Value:", opt_value)
輸出
上述程式碼產生了以下結果 -
The result of optimized Value: -2.249999999999999
示例 3
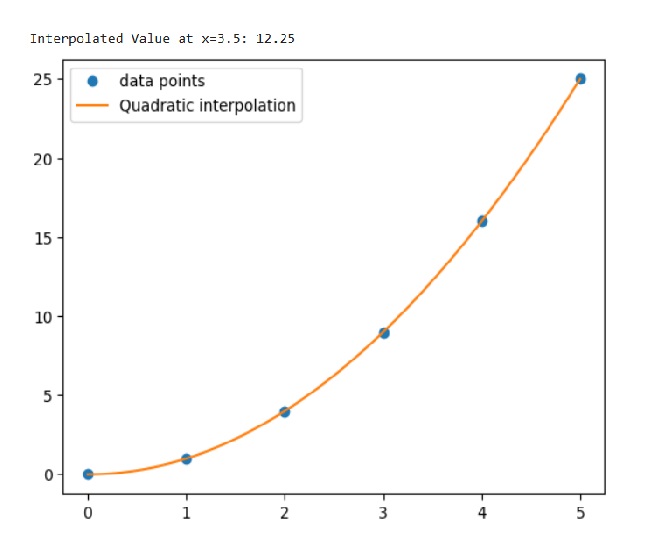
此程式確定可在變數 f 中找到的插值物件 (interp1d)。 然後,它將 float 值設為 3.5,從而在特定點評估插值函式。
import numpy as np
from scipy.interpolate import interp1d
import matplotlib.pyplot as plt

# Data points
x = np.array([0, 1, 2, 3, 4, 5])
y = np.array([0, 1, 4, 9, 16, 25])

# interpolation function
f = interp1d(x, y, kind='quadratic')

# Evaluate the interpolated function at a specific point
x_new = 3.5
y_new = f(x_new)

print("Interpolated Value at x=3.5:", y_new)

# Plot the data and the interpolation
plt.plot(x, y, 'o', label='data points')
x_dense = np.linspace(0, 5, 100)
plt.plot(x_dense, f(x_dense), '-', label='Quadratic interpolation')
plt.legend()
plt.show()
輸出
上述程式碼產生了以下結果 -
scipy_reference.htm
廣告