- SciPy 教程
- SciPy - 主頁
- SciPy - 簡介
- SciPy - 環境設定
- SciPy - 基本功能
- SciPy - 叢集
- SciPy - 常量
- SciPy - FFTpack
- SciPy - 整合
- SciPy - 插值
- SciPy - 輸入和輸出
- SciPy - 線性代數
- SciPy - N 維影像
- SciPy - 最佳化
- SciPy - 統計
- SciPy - CSGraph
- SciPy - 空間
- SciPy - ODR
- SciPy - 特殊包
- SciPy 有用資源
- SciPy - 參考
- SciPy - 快速指南
- SciPy - 有用資源
- SciPy - 討論
SciPy - single() 方法
SciPy single() 方法在下述矩陣中執行單/最小/最近連結任務。此方法的使用方式是定義兩個叢集之間的距離像兩個不同點之間的最短距離。
在資料科學領域,我們使用此方法進行叢集分析。它用於識別資料模式、對齊項和異常檢測。
語法
以下是 SciPy single() 方法的語法 −
single(y)
引數
此函式僅接受一個引數 −
- y: 此變數作為 single() 方法的引數,用於儲存資料繪製的列表陣列整數。
返回值
此方法返回連線矩陣(結果)。
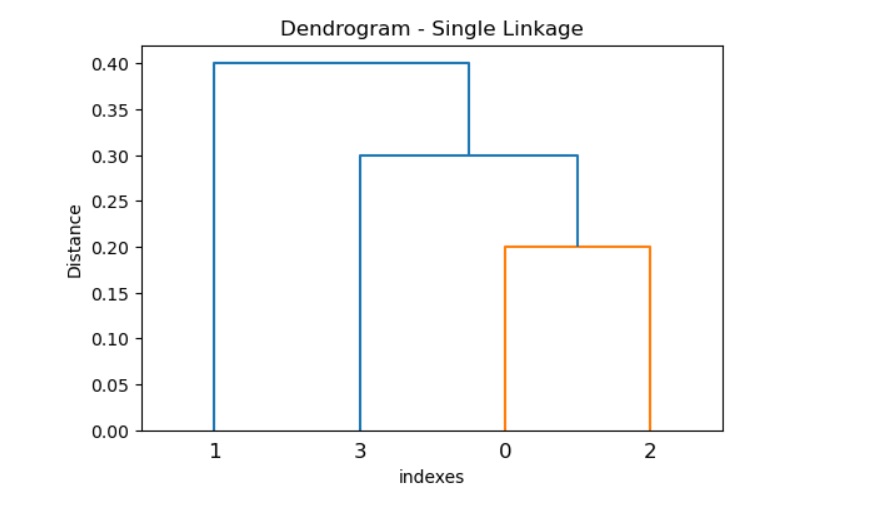
示例 1
以下是 SciPy single() 方法闡述繪製資料點的單個連結的任務。
import numpy as np
from scipy.cluster.hierarchy import single, dendrogram
import matplotlib.pyplot as plt

# Distance matrix
y = np.array([0.5, 0.2, 0.3, 0.4, 0.8, 0.6])

# single linkage clustering
result = single(y)

# Plot the dendrogram
plt.figure(figsize=(6, 4))
dendrogram(result)
plt.title('Dendrogram - Single Linkage')
plt.xlabel('indexes')
plt.ylabel('Distance')
plt.show()
輸出
上述程式碼生成以下結果 −
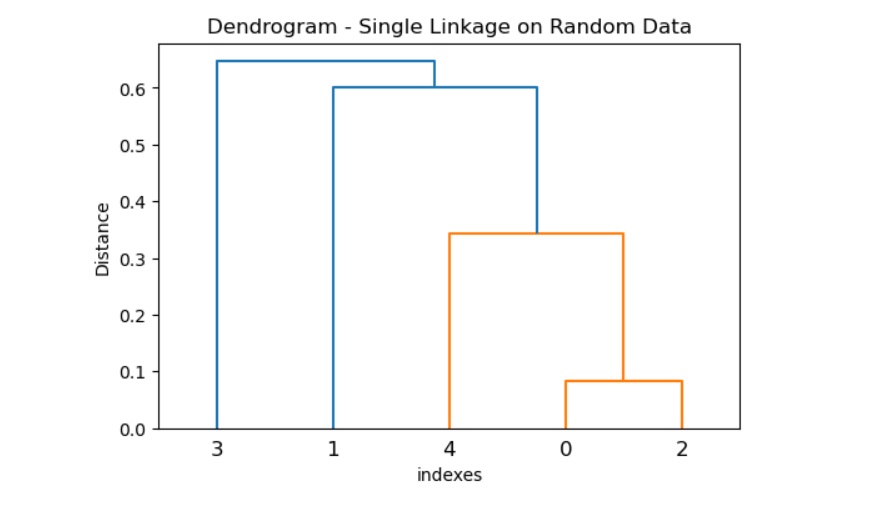
示例 2
下方提供的一個示例闡述在隨機資料上執行單個連結聚類的任務。
import numpy as np
from scipy.spatial.distance import pdist
from scipy.cluster.hierarchy import single, dendrogram
import matplotlib.pyplot as plt

# Generate random data
data = np.random.rand(5, 2)

# calculate the distance matrix
y = pdist(data, metric='euclidean')

# single linkage clustering
result = single(y)

# Plot the dendrogram
plt.figure(figsize=(6, 4))
dendrogram(result)
plt.title('Dendrogram - Single Linkage on Random Data')
plt.xlabel('indexes')
plt.ylabel('Distance')
plt.show()
輸出
上述程式碼生成以下結果 −
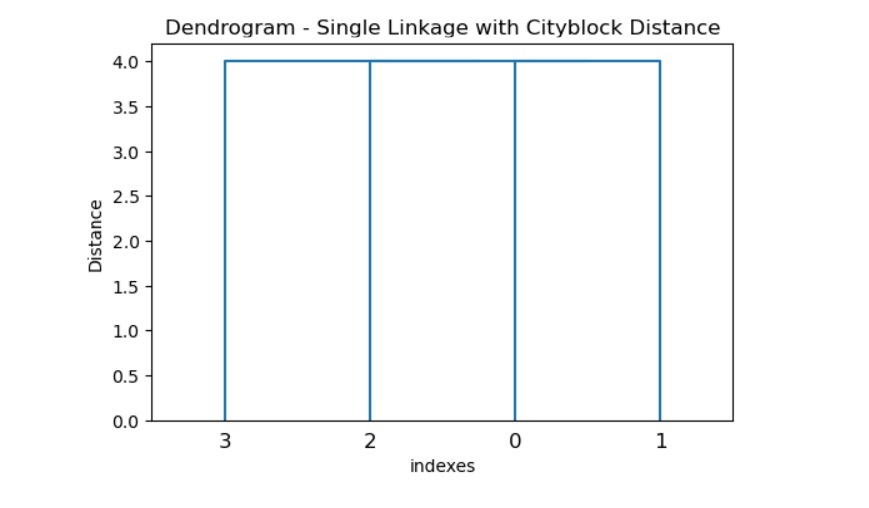
示例 3
在此示例中,我們使用cityblock 作為度量型別來從給定資料集計算距離矩陣,然後利用單個連結聚類。然後我們使用 dendogram() 方法,該方法對聚類進行繪製和視覺化很有幫助。
import numpy as np
from scipy.spatial.distance import pdist
from scipy.cluster.hierarchy import single, dendrogram
import matplotlib.pyplot as plt

# Given data
data = np.array([[1, 2], [3, 4], [5, 6], [7, 8]])

# calculate the distance matrix using a custom metric
y = pdist(data, metric='cityblock')

# single linkage clustering
result = single(y)

# Plot the dendrogram
plt.figure(figsize=(6, 4))
dendrogram(result)
plt.title('Dendrogram - Single Linkage with Cityblock Distance')
plt.xlabel('indexes')
plt.ylabel('Distance')
plt.show()
輸出
上述程式碼生成以下結果 −
scipy_reference.htm
廣告