- SciPy 教程
- SciPy - 首頁
- SciPy - 簡介
- SciPy - 環境設定
- SciPy - 基本功能
- SciPy - 聚類
- SciPy - 常量
- SciPy - FFTpack
- SciPy - 積分
- SciPy - 插值
- SciPy - 輸入和輸出
- SciPy - 線性代數 (Linalg)
- SciPy - 影像處理 (Ndimage)
- SciPy - 最佳化
- SciPy - 統計
- SciPy - 壓縮稀疏圖 (CSGraph)
- SciPy - 空間
- SciPy - 正交距離迴歸 (ODR)
- SciPy - 特殊函式包
- SciPy 有用資源
- SciPy - 參考
- SciPy - 快速指南
- SciPy - 有用資源
- SciPy - 討論
SciPy - linkage() 方法
SciPy 的 linkage() 方法用於層次聚類,可用於生成連線矩陣。該矩陣提供了矩陣資料的程式碼結構。
層次聚類透過將資料分成基於組的方式來定義。以下是資料分析中的兩種用途:
- 識別自然分組:它用於藉助自然劃分來識別分組項。
- 構建樹狀圖:這會建立一個樹狀圖,這是一種樹形圖,記錄資料的分割序列或層次結構。
此方法通常用於資料分析,將相似的專案分組到叢集中,這可以幫助我們理解資料的結構並進行預測。
語法
以下是 SciPy linkage() 方法的語法:
linkage(data, method = 'single')
or,
linkage(data, method = 'single', metric = 'type')
引數
此方法接受以下引數:
- data:此引數定義陣列形式的資料元素列表。
- method = 'single':此引數定義連結演算法的型別。
- metric = 'type':預設型別為“歐幾里得”。
返回值
此方法返回連線矩陣,其形狀為 numpy 陣列 (n-1, 4),其中 n 定義觀察次數。
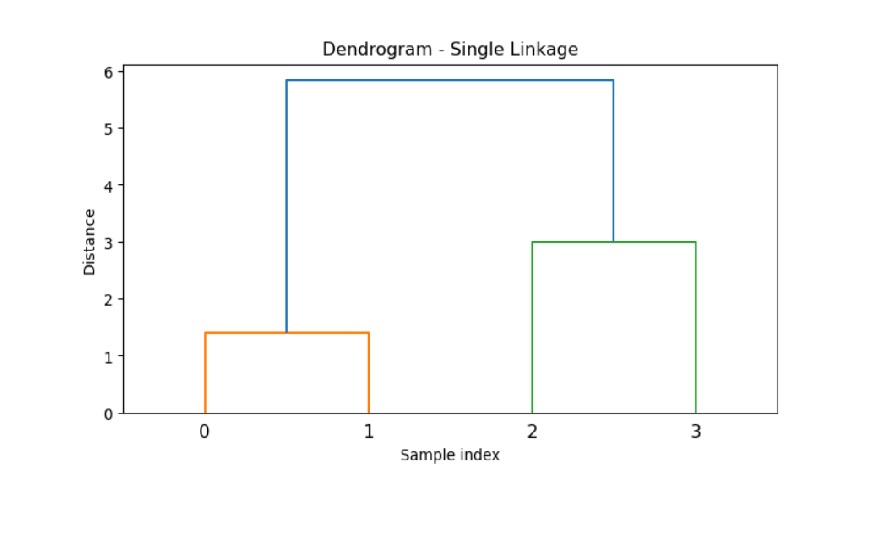
示例 1
以下是 SciPy linkage() 方法對自定義資料集進行連結聚類,並繪製樹狀圖以視覺化資料聚類過程。
import numpy as np
from scipy.cluster.hierarchy import linkage, dendrogram
import matplotlib.pyplot as plt

# Sample data
data = np.array([[1, 2], [2, 3], [5, 8], [8, 8]])

# Compute the linkage matrix using single linkage
result = linkage(data, method='single')

# Plot the dendrogram
plt.figure(figsize=(8, 4))
dendrogram(result)
plt.title('Dendrogram - Single Linkage')
plt.xlabel('Sample index')
plt.ylabel('Distance')
plt.show()
輸出
以上程式碼產生以下結果:
示例 2
在這裡,我們演示了對具有六個觀測值的資料集進行完全連結聚類,並使用歐幾里得距離度量繪製樹狀圖。
import numpy as np
from scipy.cluster.hierarchy import linkage, dendrogram
import matplotlib.pyplot as plt

# Sample data
data = np.array([[1, 2], [2, 3], [5, 8], [8, 8], [1, 0], [2, 1]])

# Compute the linkage matrix using complete linkage and Euclidean distance
result = linkage(data, method='complete', metric='euclidean')

# Plot the dendrogram
plt.figure(figsize=(8, 4))
dendrogram(result)
plt.title('Dendrogram - Complete Linkage')
plt.xlabel('Sample index')
plt.ylabel('Distance')
plt.show()
輸出
以上程式碼產生以下結果:

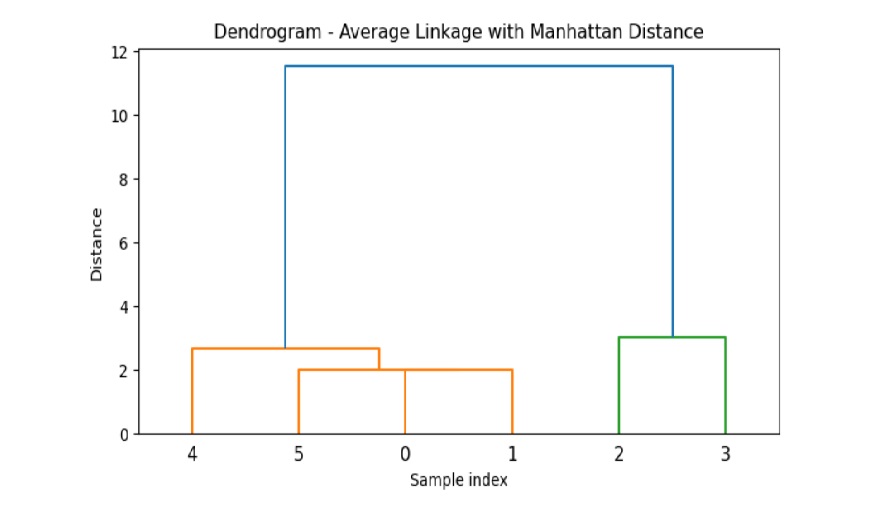
示例 3
下面的示例使用曼哈頓距離對與示例 2 相同的資料集執行平均連結聚類。這裡,它使用度量型別為“cityblock”。
請注意,曼哈頓距離是使用直角的兩個點軸測量的。它用於高維資料集。
import numpy as np
from scipy.cluster.hierarchy import linkage, dendrogram
import matplotlib.pyplot as plt

# Sample data
data = np.array([[1, 2], [2, 3], [5, 8], [8, 8], [1, 0], [2, 1]])

# Compute the linkage matrix using average linkage and Manhattan distance
result = linkage(data, method='average', metric='cityblock')

# Plot the dendrogram
plt.figure(figsize=(8, 4))
dendrogram(result)
plt.title('Dendrogram - Average Linkage with Manhattan Distance')
plt.xlabel('Sample index')
plt.ylabel('Distance')
plt.show()
輸出
以上程式碼產生以下結果:
scipy_reference.htm
廣告