- SciPy 教程
- SciPy - 首頁
- SciPy - 介紹
- SciPy - 環境設定
- SciPy - 基本功能
- SciPy - 叢集
- SciPy - 常量
- SciPy - FFTpack
- SciPy - 整合
- SciPy - 插補
- SciPy - 輸入和輸出
- SciPy - 線性代數
- SciPy - N 維影像
- SciPy - 最佳化
- SciPy - 統計
- SciPy - CSGraph
- SciPy - 空間
- SciPy - ODR
- SciPy - 特殊包
- SciPy 實用資源
- SciPy - 參考
- SciPy - 快速指南
- SciPy - 實用資源
- SciPy - 討論
SciPy - 樹圖() 方法
SciPy 樹圖() 方法引自模組“scipy.cluster.hierarchy”,它透過在特定高度處切割叢集來確定其功能。
此方法幫助我們視覺化叢集圖並顯示排列。
語法
以下是 SciPy 樹圖() 方法的語法 −
dendrogram(res)
引數
以下是說明 −
- res: 此引數儲存 linkage() 方法,該方法接受兩個引數,分別是 “data” 和 “method = 'type'” 以圖形方式生成分層叢集。
返回值
此方法渲染樹狀圖,這意味著它以圖形檢視的形式返回結果。
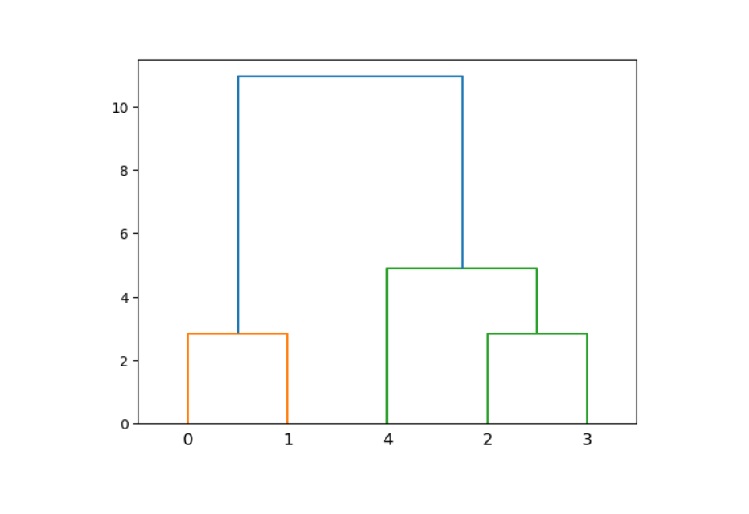
示例 1
以下是展示如何使用 樹狀圖() 方法的 SciPy 示例。
import numpy as np
from scipy.cluster.hierarchy import dendrogram, linkage
import matplotlib.pyplot as plt

# given data
data = np.array([[1, 2], [3, 4], [5, 6], [7, 8], [9, 10]])

# hierarchical clustering using ward
res = linkage(data, method='ward')

# create a dendrogram
dendrogram(res)

# show the plot
plt.show()
輸出
以上程式碼會產生以下輸出 −
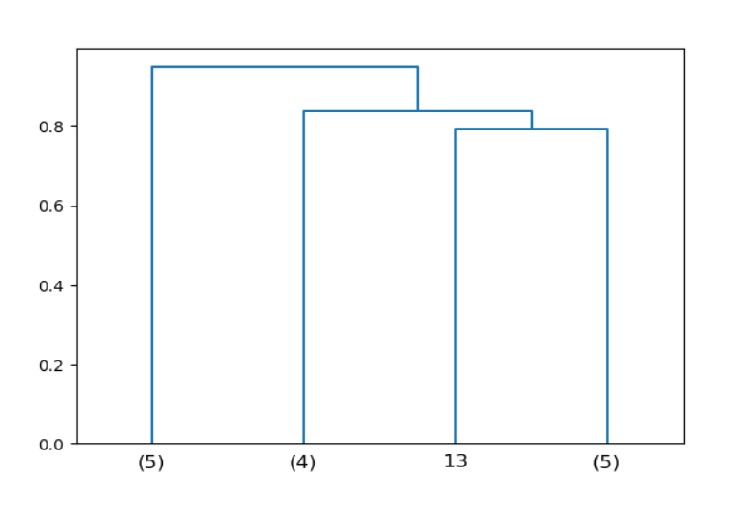
示例 2
在這裡,我們執行截斷樹狀圖的任務,它顯示了最後 4 次合併。
import numpy as np
from scipy.cluster.hierarchy import dendrogram, linkage
import matplotlib.pyplot as plt

# input data
data = np.random.rand(15, 4)

# hierarchical clustering
res = linkage(data, method='average')

# create a truncated dendrogram
dendrogram(res, truncate_mode='lastp', p=4)

# show the plot
plt.show()
輸出
以上程式碼會產生以下輸出 −
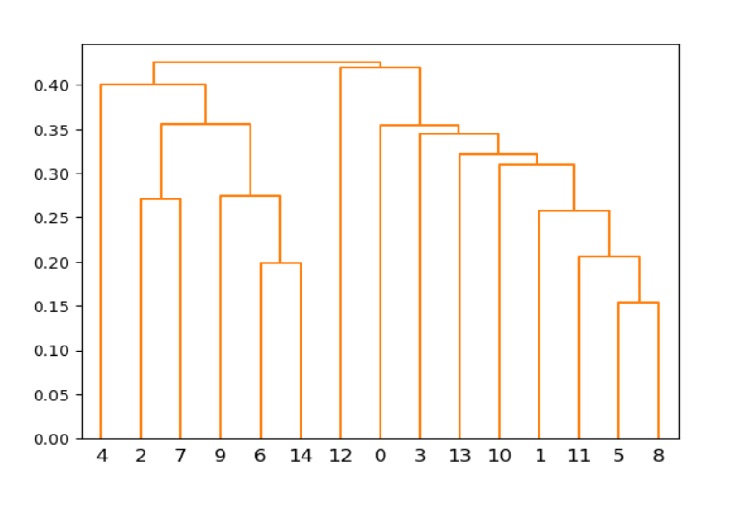
示例 3
以下示例顯示了具有顏色閾值的樹狀圖。在這裡,您可以得到橙色的圖形顏色。
注意,顏色閾值定義了圖形的更好可見性。
import numpy as np
from scipy.cluster.hierarchy import dendrogram, linkage
import matplotlib.pyplot as plt

# input data
data = np.random.rand(15, 3)

# hierarchical clustering
res = linkage(data, method='single')

# create dendrogram with color threshold
dendrogram(res, color_threshold=0.5)

# show the plot
plt.show()
輸出
以上程式碼會產生以下輸出 −
scipy_reference.htm
廣告