- SciPy 教程
- SciPy - 主頁
- SciPy - 介紹
- SciPy - 環境設定
- SciPy - 基本功能
- SciPy - 叢集
- SciPy - 常量
- SciPy - FFTpack
- SciPy - 整合
- SciPy - 插值
- SciPy - 輸入和輸出
- SciPy - 線性代數
- SciPy - Ndimage
- SciPy - 最佳化
- SciPy - 統計
- SciPy - CSGraph
- SciPy - 空間
- SciPy - ODR
- SciPy - 特殊包
- SciPy 有用資源
- SciPy - 參考文獻
- SciPy - 快速指南
- SciPy - 有用資源
- SciPy - 討論
SciPy - average() 方法
SciPy average() 方法用於執行距離矩陣的算術平均任務。在資料分析中,此方法有助於我們從資料點建立層次結構的簇。
此方法將兩個簇之間的距離稱為所有資料點對之間的平均距離,其中一個點來自第一個簇,另一個點來自第二個簇。
語法
以下是 SciPy average() 方法的語法 -
average(y)
引數
此方法接受一個引數 -
- y: 此引數儲存距離陣列矩陣。
返回值
此方法返回鏈路矩陣(結果)。
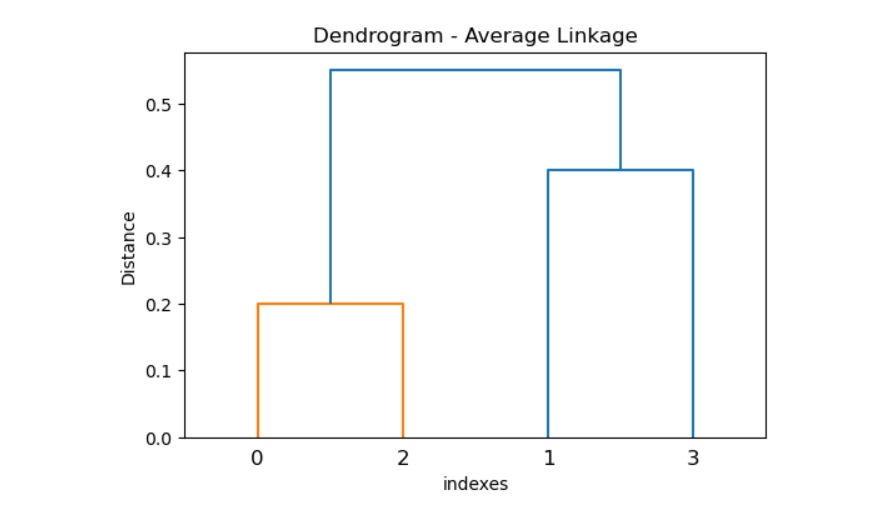
示例 1
以下是 SciPy average() 方法執行距離矩陣任務。
import numpy as np
from scipy.cluster.hierarchy import average, dendrogram
import matplotlib.pyplot as plt

# Distance matrix
y = np.array([0.6, 0.2, 0.3, 0.5, 0.4, 0.8])

# Perform average linkage clustering
result = average(y)

# Plot the dendrogram
plt.figure(figsize=(6, 4))
dendrogram(result)
plt.title('Dendrogram - Average Linkage')
plt.xlabel('indexes')
plt.ylabel('Distance')
plt.show()
輸出
以上程式碼會產生以下結果 -
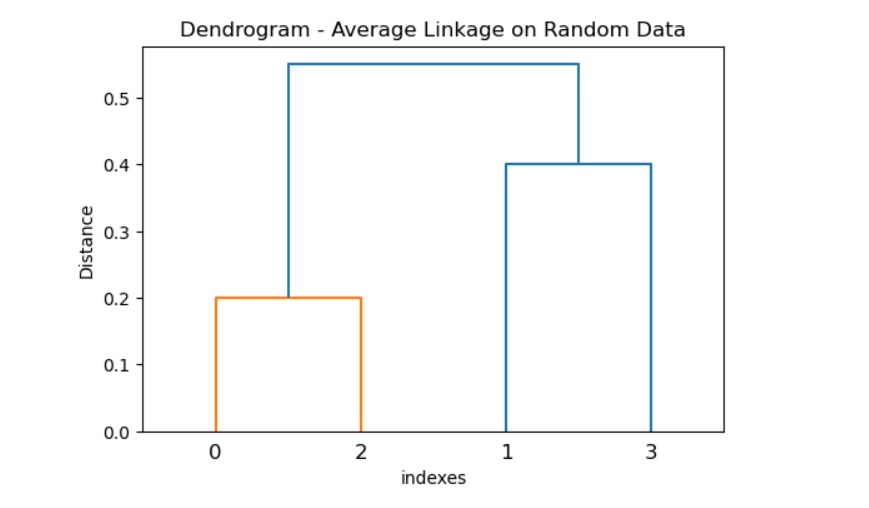
示例 2
下面的示例對隨機資料集執行平均連鎖聚類任務。
import numpy as np
from scipy.spatial.distance import pdist
from scipy.cluster.hierarchy import average, dendrogram
import matplotlib.pyplot as plt

# generate random data
data = np.random.rand(4, 2)

# calculate the distance matrix
y = pdist(data, metric='euclidean')

# average linkage clustering
result = average(result)

# plot the dendrogram
plt.figure(figsize=(6, 4))
dendrogram(Z)
plt.title('Dendrogram - Average Linkage on Random Data')
plt.xlabel('indexes')
plt.ylabel('Distance')
plt.show()
輸出
以上程式碼會產生以下結果 -
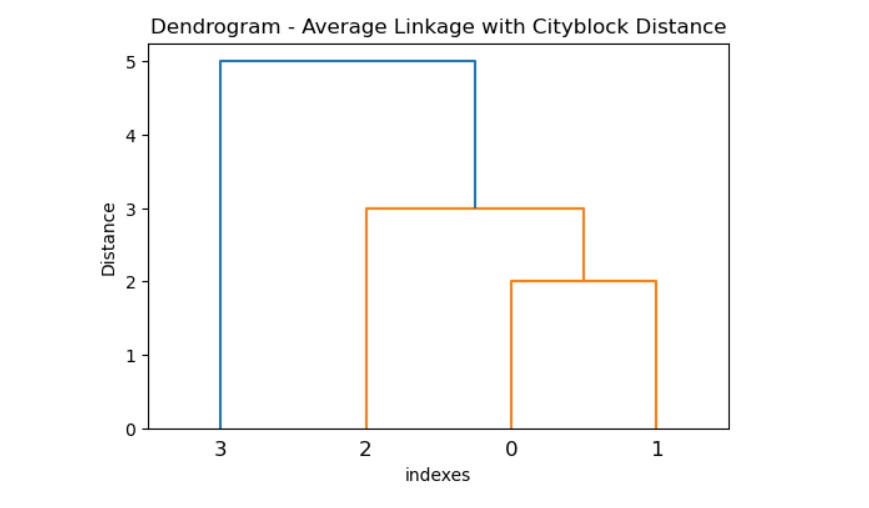
示例 3
為了獲得平均聚類連鎖,它使用 dendrogram() 來視覺化資料並生成預期結果。在此,我們提到度量型別為“cityblock”。
import numpy as np
from scipy.spatial.distance import pdist
from scipy.cluster.hierarchy import average, dendrogram
import matplotlib.pyplot as plt

# sample data
data = np.array([[1, 5], [2, 4], [3, 6], [4, 8]])

# calculate the distance matrix using a custom metric
y = pdist(data, metric='cityblock')

# average linkage clustering
result = average(y)

# Plot the dendrogram
plt.figure(figsize=(6, 4))
dendrogram(result)
plt.title('Dendrogram - Average Linkage with Cityblock Distance')
plt.xlabel('indexes')
plt.ylabel('Distance')
plt.show()
輸出
以上程式碼會產生以下結果 -
scipy_reference.htm
廣告