- Python 資料科學教程
- Python 資料科學 - 首頁
- Python 資料科學 - 入門
- Python 資料科學 - 環境設定
- Python 資料科學 - Pandas
- Python 資料科學 - Numpy
- Python 資料科學 - SciPy
- Python 資料科學 - Matplotlib
- Python 資料處理
- Python 資料操作
- Python 資料清洗
- Python 處理 CSV 資料
- Python 處理 JSON 資料
- Python 處理 XLS 資料
- Python 關係型資料庫
- Python NoSQL 資料庫
- Python 日期和時間
- Python 資料整理
- Python 資料聚合
- Python 讀取 HTML 頁面
- Python 處理非結構化資料
- Python 詞語標記化
- Python 詞幹提取和詞形還原
- Python 資料視覺化
- Python 圖表屬性
- Python 圖表樣式
- Python 箱線圖
- Python 熱力圖
- Python 散點圖
- Python 氣泡圖
- Python 3D 圖表
- Python 時間序列
- Python 地理資料
- Python 圖資料
Python - 時間序列
時間序列是一系列資料點,其中每個資料點都與一個時間戳相關聯。一個簡單的例子是股票市場中某隻股票在給定日期的不同時間點的價格。另一個例子是某一地區一年中不同月份的降雨量。
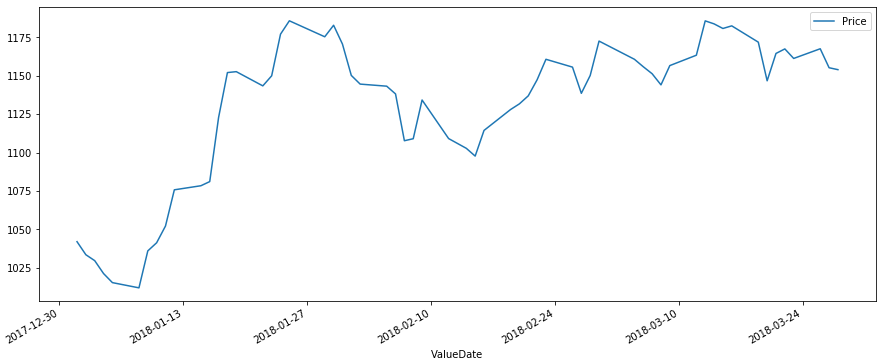
在下面的示例中,我們獲取特定股票程式碼在某一季度每天的股票價格值。我們將這些值捕獲為 csv 檔案,然後使用 pandas 庫將其組織到資料框中。然後,我們透過將額外的 Valuedate 列重新建立為索引並刪除舊的 valuedate 列,將日期欄位設定為資料框的索引。
示例資料
以下是給定季度不同日期股票價格的示例資料。資料儲存在名為 stock.csv 的檔案中。
ValueDate	Price
01-01-2018,	1042.05
02-01-2018,	1033.55
03-01-2018,	1029.7
04-01-2018,	1021.3
05-01-2018,	1015.4
...
...
...
...
23-03-2018,	1161.3
26-03-2018,	1167.6
27-03-2018,	1155.25
28-03-2018,	1154
建立時間序列
from datetime import datetime
import pandas as pd
import matplotlib.pyplot as plt

data = pd.read_csv('path_to_file/stock.csv')
df = pd.DataFrame(data, columns = ['ValueDate', 'Price'])

# Set the Date as Index
df['ValueDate'] = pd.to_datetime(df['ValueDate'])
df.index = df['ValueDate']
del df['ValueDate']


df.plot(figsize=(15, 6))
plt.show()
其輸出如下所示:
廣告