- Python 資料科學教程
- Python 資料科學 - 主頁
- Python 資料科學 - 入門
- Python 資料科學 - 環境設定
- Python 資料科學 - Pandas
- Python 資料科學 - Numpy
- Python 資料科學 - SciPy
- Python 資料科學 - Matplotlib
- Python 資料處理
- Python 資料操作
- Python 資料清理
- Python 處理 CSV 資料
- Python 處理 JSON 資料
- Python 處理 XLS 資料
- Python 關係資料庫
- Python NoSQL 資料庫
- Python 日期和時間
- Python 資料處理
- Python 資料聚合
- Python 讀取 HTML 頁面
- Python 處理非結構化資料
- Python 詞彙標記
- Python 詞幹提取和詞形還原
- Python 資料視覺化
- Python 圖表屬性
- Python 圖表樣式
- Python 箱形圖
- Python 熱圖
- Python 散點圖
- Python 氣泡圖
- Python 3D 圖表
- Python 時間序列
- Python 地理資料
- Python 圖形資料
Python - 地理資料
許多開源 Python 庫現已建立用於表示地理地圖。它們具備高度可定製性,並提供多種形狀和顏色的地圖,描繪不同區域。Cartopy 就是其中之一。你可以從 Cartopy 下載並在自己本地環境中安裝此軟體包。你可以在其相簿中找到許多示例。
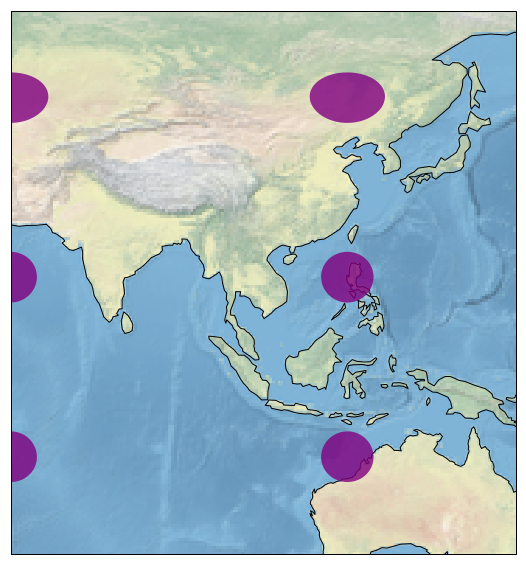
在下例中,我們展示了世界地圖的一部分,顯示了亞洲和澳大利亞的部分地區。你可以調整方法 set_extent 中的引數值,以定位世界地圖的不同區域。
import matplotlib.pyplot as plt
import cartopy.crs as ccrs

fig = plt.figure(figsize=(15, 10))
ax = fig.add_subplot(1, 1, 1, projection=ccrs.PlateCarree())

    # make the map global rather than have it zoom in to
    # the extents of any plotted data

ax.set_extent((60, 150, 55, -25))

ax.stock_img()
ax.coastlines()

ax.tissot(facecolor='purple', alpha=0.8)

plt.show()
它的輸出如下 -
廣告