- Python 資料科學教程
- Python 資料科學 - 主頁
- Python 資料科學 - 入門
- Python 資料科學 - 環境設定
- Python 資料科學 - Pandas
- Python 資料科學 - Numpy
- Python 資料科學 - SciPy
- Python 資料科學 - Matplotlib
- Python 資料處理
- Python 資料操作
- Python 資料清理
- Python 處理 CSV 資料
- Python 處理 JSON 資料
- Python 處理 XLS 資料
- Python 關係資料庫
- Python NoSQL 資料庫
- Python 日期和時間
- Python 資料整理
- Python 資料聚合
- Python 讀取 HTML 頁面
- Python 處理非結構化資料
- Python 詞彙標記化
- Python 詞幹提取和詞形還原
- Python 資料視覺化
- Python 圖表屬性
- Python 圖表樣式
- Python 箱線圖
- Python 熱力圖
- Python 散點圖
- Python 氣泡圖
- Python 3D 圖表
- Python 時間序列
- Python 地理資料
- Python 圖形資料
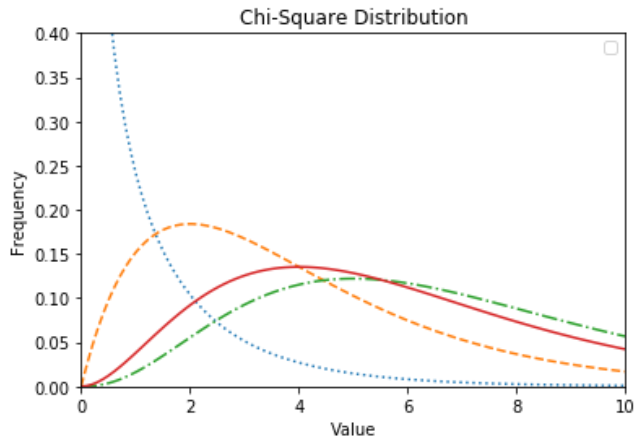
Python - 卡方檢驗
卡方檢驗是一種統計方法,用於確定兩個分類變數是否在它們之間具有顯著相關性。這兩個變數都應來自同一總體,並且它們應為分類變數,如 - 是/否、男/女、紅/綠等。例如,我們可以建立一個關於人們購買冰淇淋方式的資料集,並嘗試將一個人的性別與他們喜歡的冰淇淋口味相關聯。如果發現了相關性,我們可以通過了解來訪人群的性別數量來計劃適當的口味庫存。
我們使用 numpy 庫中的各種函式來執行卡方檢驗。
from scipy import stats
import numpy as np
import matplotlib.pyplot as plt

x = np.linspace(0, 10, 100)
fig,ax = plt.subplots(1,1)

linestyles = [':', '--', '-.', '-']
deg_of_freedom = [1, 4, 7, 6]
for df, ls in zip(deg_of_freedom, linestyles):
  ax.plot(x, stats.chi2.pdf(x, df), linestyle=ls)

plt.xlim(0, 10)
plt.ylim(0, 0.4)

plt.xlabel('Value')
plt.ylabel('Frequency')
plt.title('Chi-Square Distribution')

plt.legend()
plt.show()
它的輸出如下 -
廣告