- Python 資料科學教程
- Python 資料科學 - 首頁
- Python 資料科學 - 入門
- Python 資料科學 - 環境設定
- Python 資料科學 - Pandas
- Python 資料科學 - Numpy
- Python 資料科學 - SciPy
- Python 資料科學 - Matplotlib
- Python 資料處理
- Python 資料操作
- Python 資料清洗
- Python 處理 CSV 資料
- Python 處理 JSON 資料
- Python 處理 XLS 資料
- Python 關係型資料庫
- Python NoSQL 資料庫
- Python 日期和時間
- Python 資料整理
- Python 資料聚合
- Python 讀取 HTML 頁面
- Python 處理非結構化資料
- Python 詞語標記化
- Python 詞幹提取和詞形還原
- Python 資料視覺化
- Python 圖表屬性
- Python 圖表樣式
- Python 箱線圖
- Python 熱力圖
- Python 散點圖
- Python 氣泡圖
- Python 3D 圖表
- Python 時間序列
- Python 地理資料
- Python 圖資料
Python 資料科學 - Matplotlib
什麼是 Matplotlib?
Matplotlib 是一個 Python 庫,用於使用 Python 指令碼建立 2D 圖表和繪圖。它有一個名為 pyplot 的模組,透過提供控制線型、字型屬性、格式化軸等功能,使繪圖變得更容易。它支援各種各樣的圖表和繪圖,例如直方圖、條形圖、功率譜、誤差圖等。它與 NumPy 一起使用,提供了一個有效開源的 MatLab 替代環境。它還可以與 PyQt 和 wxPython 等圖形工具包一起使用。
通常,透過新增以下語句將包匯入 Python 指令碼中:
from matplotlib import pyplot as plt
Matplotlib 示例
以下指令碼使用 matplotlib 生成**正弦波圖**。
示例
import numpy as np
import matplotlib.pyplot as plt

# Compute the x and y coordinates for points on a sine curve
x = np.arange(0, 3 * np.pi, 0.1)
y = np.sin(x)
plt.title("sine wave form")

# Plot the points using matplotlib
plt.plot(x, y)
plt.show()
其**輸出**如下:
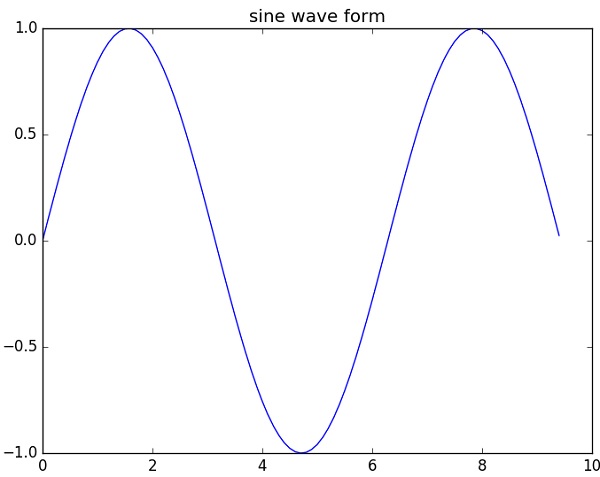
在接下來的章節中,我們將看到許多關於在資料科學工作中使用 Python 的 Matplotlib 庫的示例。
廣告