- Plotly 教程
- Plotly - 首頁
- Plotly - 簡介
- Plotly - 環境設定
- Plotly - 線上和離線繪圖
- 在 Jupyter Notebook 中內聯繪圖
- Plotly - 包結構
- Plotly - 匯出為靜態影像
- Plotly - 圖例
- Plotly - 格式化座標軸和刻度
- Plotly - 子圖和內嵌圖
- Plotly - 條形圖和餅圖
- Plotly - 散點圖、Scattergl 圖和氣泡圖
- Plotly - 點圖和表格
- Plotly - 直方圖
- Plotly - 箱線圖、小提琴圖和等高線圖
- Plotly - 分佈圖、密度圖和誤差條形圖
- Plotly - 熱力圖
- Plotly - 極座標圖和雷達圖
- Plotly - OHLC 圖、瀑布圖和漏斗圖
- Plotly - 3D 散點圖和曲面圖
- Plotly - 新增按鈕/下拉選單
- Plotly - 滑塊控制元件
- Plotly - FigureWidget 類
- Plotly 與 Pandas 和 Cufflinks
- Plotly 與 Matplotlib 和 Chart Studio
- Plotly 有用資源
- Plotly - 快速指南
- Plotly - 有用資源
- Plotly - 討論
Plotly - 子圖和內嵌圖
在這裡,我們將瞭解 Plotly 中子圖和內嵌圖的概念。
建立子圖
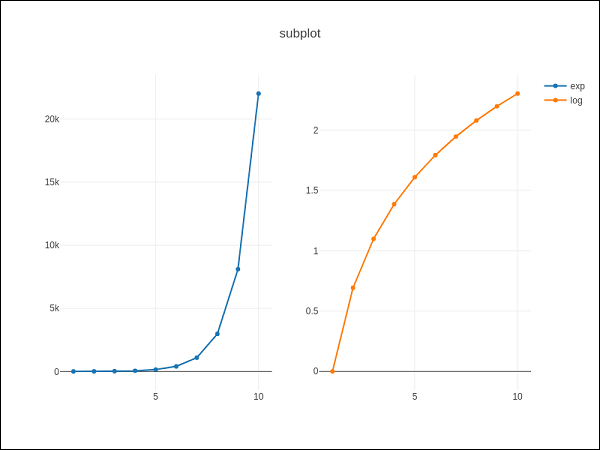
有時,並排比較資料的不同檢視會很有幫助。這支援子圖的概念。它在plotly.tools 模組中提供make_subplots() 函式。該函式返回一個 Figure 物件。
以下語句在一行中建立兩個子圖。
fig = tools.make_subplots(rows = 1, cols = 2)
我們現在可以將兩個不同的軌跡(上面示例中的 exp 和 log 軌跡)新增到圖形中。
fig.append_trace(trace1, 1, 1)
fig.append_trace(trace2, 1, 2)
使用update() 方法進一步配置圖形的佈局,指定標題、寬度、高度等。
fig['layout'].update(height = 600, width = 800s, title = 'subplots')
這是完整的指令碼:
from plotly import tools
import plotly.plotly as py
import plotly.graph_objs as go
from plotly.offline import iplot, init_notebook_mode
init_notebook_mode(connected = True)
import numpy as np
x = np.arange(1,11)
y1 = np.exp(x)
y2 = np.log(x)
trace1 = go.Scatter(
   x = x,
   y = y1,
   name = 'exp'
)
trace2 = go.Scatter(
   x = x,
   y = y2,
   name = 'log'
)
fig = tools.make_subplots(rows = 1, cols = 2)
fig.append_trace(trace1, 1, 1)
fig.append_trace(trace2, 1, 2)
fig['layout'].update(height = 600, width = 800, title = 'subplot')
iplot(fig)
這是您的繪圖網格的格式:[ (1,1) x1,y1 ] [ (1,2) x2,y2 ]
內嵌圖
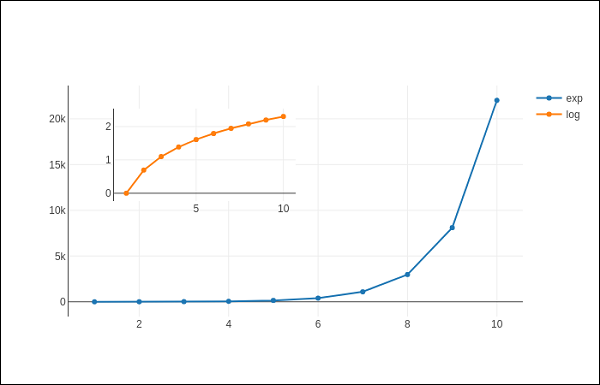
要將子圖顯示為內嵌圖,我們需要配置其軌跡物件。首先將內嵌軌跡的xaxis 和 yaxis 屬性分別設定為‘x2’ 和‘y2’。以下語句將‘log’ 軌跡放在內嵌圖中。
trace2 = go.Scatter(
   x = x,
   y = y2,
   xaxis = 'x2',
   yaxis = 'y2',
   name = 'log'
)
其次,配置 Layout 物件,其中內嵌圖的 x 軸和 y 軸的位置由domain 屬性定義,該屬性指定其相對於主軸的位置。
xaxis2=dict(
   domain = [0.1, 0.5],
   anchor = 'y2'
),
yaxis2 = dict(
   domain = [0.5, 0.9],
   anchor = 'x2'
)
下面給出了在內嵌圖中顯示 log 軌跡並在主軸上顯示 exp 軌跡的完整指令碼:
trace1 = go.Scatter(
   x = x,
   y = y1,
   name = 'exp'
)
trace2 = go.Scatter(
   x = x,
   y = y2,
   xaxis = 'x2',
   yaxis = 'y2',
   name = 'log'
)
data = [trace1, trace2]
layout = go.Layout(
   yaxis = dict(showline = True),
   xaxis2 = dict(
      domain = [0.1, 0.5],
      anchor = 'y2'
   ),
   yaxis2 = dict(
      showline = True,
      domain = [0.5, 0.9],
      anchor = 'x2'
   )
)
fig = go.Figure(data=data, layout=layout)
iplot(fig)
輸出如下:
廣告