- Plotly 教程
- Plotly - 首頁
- Plotly - 簡介
- Plotly - 環境設定
- Plotly - 線上和離線繪圖
- 在 Jupyter Notebook 中內聯繪圖
- Plotly - 包結構
- Plotly - 匯出為靜態影像
- Plotly - 圖例
- Plotly - 格式化軸和刻度
- Plotly - 子圖和嵌入圖
- Plotly - 條形圖和餅圖
- Plotly - 散點圖、Scattergl 圖和氣泡圖
- Plotly - 點圖和表格
- Plotly - 直方圖
- Plotly - 箱線圖、小提琴圖和等高線圖
- Plotly - Distplots、密度圖和誤差條形圖
- Plotly - 熱圖
- Plotly - 極座標圖和雷達圖
- Plotly - OHLC 圖、瀑布圖和漏斗圖
- Plotly - 3D 散點圖和曲面圖
- Plotly - 新增按鈕/下拉選單
- Plotly - 滑塊控制元件
- Plotly - FigureWidget 類
- Plotly 與 Pandas 和 Cufflinks
- Plotly 與 Matplotlib 和 Chart Studio
- Plotly 有用資源
- Plotly - 快速指南
- Plotly - 有用資源
- Plotly - 討論
Plotly - FigureWidget 類
Plotly 3.0.0 引入了一個新的 Jupyter 小部件類:plotly.graph_objs.FigureWidget。它與我們現有的 Figure 具有相同的呼叫簽名,並且它是專門為Jupyter Notebook 和JupyterLab 環境而設計的。
go.FigureWiget() 函式返回一個帶有預設 x 和y 軸的空 FigureWidget 物件。
f = go.FigureWidget()
iplot(f)
以下是程式碼的輸出 -
FigureWidget 最重要的特性是生成的 Plotly 圖形,並且隨著我們不斷向其中新增資料和其他佈局屬性,它可以動態更新。
例如,逐個新增以下圖形軌跡,並檢視原始空圖形的動態更新。這意味著我們不必一次又一次地呼叫 iplot() 函式,因為繪圖會自動重新整理。FigureWidget 的最終外觀如下所示 -
f.add_scatter(y = [2, 1, 4, 3]);
f.add_bar(y = [1, 4, 3, 2]);
f.layout.title = 'Hello FigureWidget'

此小部件能夠為懸停、點選和選擇點以及放大區域新增事件監聽器。
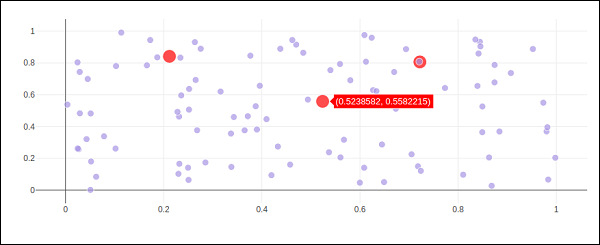
在以下示例中,FigureWidget 被程式設計為響應繪圖區域上的點選事件。小部件本身包含一個帶有標記的簡單散點圖。滑鼠點選位置用不同的顏色和大小標記。
x = np.random.rand(100)
y = np.random.rand(100)
f = go.FigureWidget([go.Scatter(x=x, y=y, mode='markers')])

scatter = f.data[0]
colors = ['#a3a7e4'] * 100

scatter.marker.color = colors
scatter.marker.size = [10] * 100
f.layout.hovermode = 'closest'
def update_point(trace, points, selector):

c = list(scatter.marker.color)
s = list(scatter.marker.size)
for i in points.point_inds:

c[i] = 'red'
s[i] = 20

scatter.marker.color = c
scatter.marker.size = s
scatter.on_click(update_point)
f
在 Jupyter notebook 中執行以上程式碼。將顯示一個散點圖。點選區域中的某個位置,該位置將用紅色標記。
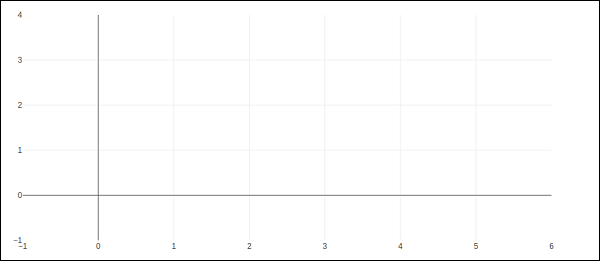
Plotly 的 FigureWidget 物件也可以使用Ipython 自身的小部件。在這裡,我們使用在ipwidgets 模組中定義的互動控制元件。我們首先構造一個FigureWidget 並新增一個空散點圖。
from ipywidgets import interact
fig = go.FigureWidget()
scatt = fig.add_scatter()
fig
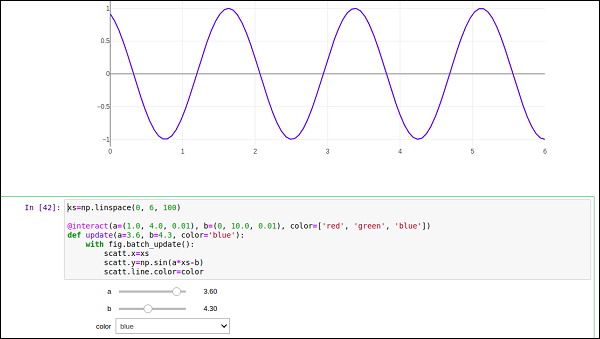
我們現在定義一個更新函式,該函式輸入頻率和相位,並設定上面定義的散點軌跡的 x 和y 屬性。ipywidgets 模組中的@interact 裝飾器用於建立一組簡單的小部件來控制繪圖的引數。更新函式使用ipywidgets 包中的@interact 裝飾器進行裝飾。裝飾器引數用於指定我們要掃描的引數範圍。
xs = np.linspace(0, 6, 100)
@interact(a = (1.0, 4.0, 0.01), b = (0, 10.0, 0.01), color = ['red', 'green', 'blue'])
def update(a = 3.6, b = 4.3, color = 'blue'):
with fig.batch_update():
scatt.x = xs
scatt.y = np.sin(a*xs-b)
scatt.line.color = color
空 FigureWidget 現在以藍色填充,其中正弦曲線 a 和b 分別為 3.6 和 4.3。在當前筆記本單元格下方,您將獲得一組用於選擇a 和b 值的滑塊。還有一個下拉選單用於選擇軌跡顏色。這些引數在@interact 裝飾器中定義。