- Plotly 教程
- Plotly - 主頁
- Plotly - 簡介
- Plotly - 環境設定
- Plotly - 線上和離線繪圖
- 使用 Jupyter Notebook 進行內聯繪圖
- Plotly - 軟體包結構
- Plotly - 匯出為靜態影像
- Plotly - 圖例
- Plotly - 格式化軸和刻度
- Plotly - 子圖和內嵌圖
- Plotly - 條形圖和餅圖
- Plotly - 散點圖、Scattergl 圖和氣泡圖
- Plotly - 點圖和表格
- Plotly - 直方圖
- Plotly - 箱形圖、小提琴圖和等值線圖
- Plotly - 分佈圖、密度圖和誤差棒圖
- Plotly - 熱圖
- Plotly - 極座標圖和雷達圖
- Plotly - OHLC 圖、瀑布圖和漏斗圖
- Plotly - 三維散點和曲面圖
- Plotly - 新增按鈕/下拉選單
- Plotly - 滑塊控制元件
- Plotly - FigureWidget 類
- Plotly 和 Pandas 以及 Cufflinks
- Plotly 和 Matplotlib 以及 Chart Studio
- Plotly 有用資源
- Plotly - 快速指南
- Plotly - 有用資源
- Plotly - 討論
Plotly - 使用 Jupyter Notebook 進行內聯繪圖
在本章中,我們將學習如何使用 Jupyter Notebook 進行內聯繪圖。
若要在 notebook 內顯示繪圖,你需要按照以下方法啟動 plotly 的 notebook 模式 −
from plotly.offline import init_notebook_mode
init_notebook_mode(connected = True)
保留其餘指令碼原樣,然後按 Shift+Enter 執行 notebook 單元格。圖形將離線顯示在 notebook 內部。
import plotly
plotly.tools.set_credentials_file(username = 'lathkar', api_key = '************')
from plotly.offline import iplot, init_notebook_mode
init_notebook_mode(connected = True)

import plotly
import plotly.graph_objs as go
import numpy as np
import math #needed for definition of pi

xpoints = np.arange(0, math.pi*2, 0.05)
ypoints = np.sin(xpoints)
trace0 = go.Scatter(
   x = xpoints, y = ypoints
)
data = [trace0]
plotly.offline.iplot({ "data": data,"layout": go.Layout(title="Sine wave")})
Jupyter notebook 輸出將如下所示 −
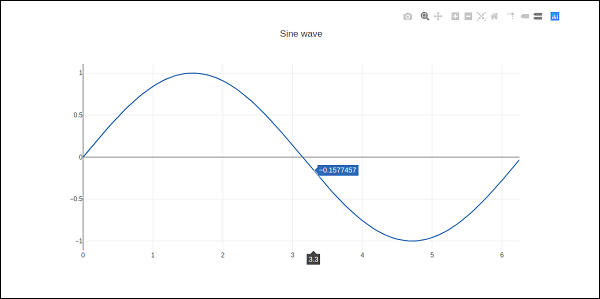
繪圖輸出顯示 右上角 的 工具欄。它包含用於以 png 下載、放大和縮小、框和套索、選擇 和 懸停 的按鈕。

廣告