- Google Colab 教程
- Google Colab - 主頁
- Google Colab - 簡介
- 什麼是 Google Colab?
- 你的第一個 Colab 筆記本
- 記錄你的程式碼
- Google Colab - 儲存你的工作
- Google Colab - 分享筆記本
- 呼叫系統命令
- 執行外部 Python 檔案
- Google Colab - 圖形輸出
- Google Colab - 程式碼編輯幫助
- Google Colab - Magics
- Google Colab - 新增 Form
- Google Colab - 安裝 ML 庫
- Google Colab - 使用免費 GPU
- Google Colab - 結論
- Google Colab 有用資源
- Google Colab - 快速指南
- Google Colab - 有用資源
- Google Colab - 討論
Google Colab - 圖形輸出
Colab 還支援圖表等豐富的輸出。在程式碼單元中輸入以下程式碼。
import numpy as np
from matplotlib import pyplot as plt

y = np.random.randn(100)
x = [x for x in range(len(y))]

plt.plot(x, y, '-')
plt.fill_between(x, y, 200, where = (y > 195), facecolor='g', alpha=0.6)

plt.title("Sample Plot")
plt.show()
現在,如果你執行程式碼,你會看到以下輸出 -
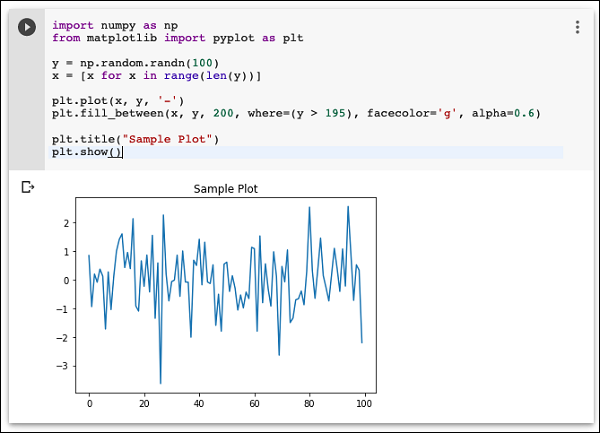
請注意,圖形輸出會顯示在程式碼單元的輸出部分。同樣,你將能夠在你的程式程式碼中建立和顯示多種型別的圖表。
現在,你已經熟悉了 Colab 的基礎知識,讓我們繼續瞭解 Colab 中讓你的 Python 程式碼開發更輕鬆的功能。
廣告