- Seaborn 教程
- Seaborn - 首頁
- Seaborn - 簡介
- Seaborn - 環境搭建
- 匯入資料集和庫
- Seaborn - 圖形美學
- Seaborn - 調色盤
- Seaborn - 直方圖
- Seaborn - 核密度估計
- 視覺化成對關係
- Seaborn - 繪製分類資料
- 觀測值的分佈
- Seaborn - 統計估計
- Seaborn - 繪製寬格式資料
- 多面板分類圖
- Seaborn - 線性關係
- Seaborn - Facet Grid
- Seaborn - Pair Grid
- 函式參考
- Seaborn - 函式參考
- Seaborn 有用資源
- Seaborn - 快速指南
- Seaborn - 有用資源
- Seaborn - 討論
Seaborn.set_theme 方法
Seaborn.set_theme() 方法用於設定控制繪圖整體樣式的引數。換句話說,此方法從視覺上設定了 matplotlib 和 seaborn 繪圖的所有方面。
此函式執行的主題設定分為各種引數值集,同時使用 matplotlib rcParams 系統更改所有繪圖的預設值。
語法
以下是 set_theme() 方法的語法:
seaborn.set_theme(context='notebook', style='darkgrid', palette='deep', font='sans-serif', font_scale=1, color_codes=True, rc=None)
引數
下面將討論此方法的引數。
| 序號 | 方法和描述 |
|---|---|
| 1 | 上下文 接收字串或字典作為輸入並縮放參數。 |
| 2 | 樣式 接收字串或字典作為輸入並確定軸樣式引數 |
| 3 | 調色盤 接收字串或序列作為輸入並確定顏色調色盤 |
| 4 | 字型 接收字串作為輸入並設定繪圖的字體系列。 |
| 5 | 字型大小 接收浮點值作為輸入並將縮放因子分開以獨立縮放字型元素的大小。 |
| 6 | 顏色程式碼 接收布林值,如果為真且調色盤為 seaborn 調色盤,則將簡寫顏色程式碼重新對映到此調色盤中的顏色。 |
| 7 | rc 接收字典作為輸入並接收值以覆蓋上述值。 |
載入 seaborn 庫
在繼續開發繪圖之前,讓我們載入 seaborn 庫和資料集。要載入或匯入 seaborn 庫,可以使用以下程式碼行。
Import seaborn as sns
載入資料集
在本文中,我們將使用 seaborn 庫中內建的 Tips 資料集。以下命令用於載入資料集。
tips=sns.load_dataset("tips")
以下命令用於檢視資料集中的前 5 行。這使我們能夠了解可以使用哪些變數來繪製圖形。
tips.head()
以下是上述程式碼段的輸出。
index,total_bill,tip,sex,smoker,day,time,size
0,16.99,1.01,Female,No,Sun,Dinner,2
1,10.34,1.66,Male,No,Sun,Dinner,3
2,21.01,3.5,Male,No,Sun,Dinner,3
3,23.68,3.31,Male,No,Sun,Dinner,2
4,24.59,3.61,Female,No,Sun,Dinner,4
現在我們已經載入了資料,我們將繼續瞭解以下示例中該方法的工作原理。
示例 1
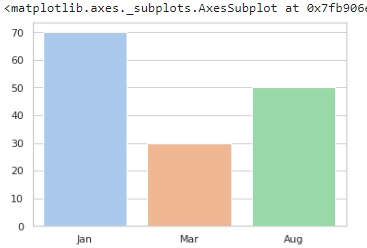
我們在下面的程式碼中設定主題,然後繪製條形圖以檢視更改是否已反映。在下面的程式碼中,主題的樣式設定為“whitegrid”,調色盤為 pastel,這意味著獲得的繪圖將包含柔和的顏色。稍後初始化條形圖以檢視繪圖,條形圖的 x 和 y 引數是包含一些要繪製的值的列表。
import seaborn as sns
import matplotlib.pyplot as plt
tips=sns.load_dataset("tips")
tips.head()
sns.set_theme(style="whitegrid", palette="pastel")
sns.barplot(x=["Jan", "Mar", "Aug"], y=[70, 30, 50])
plt.show()
輸出
示例 2
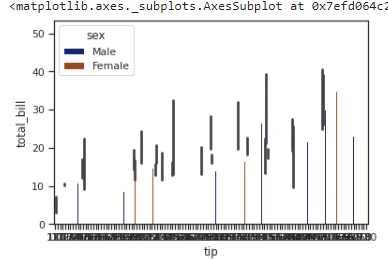
在本例中,我們將使用 tips 資料集進行繪圖,而不是像在前面的示例中那樣進行初始化。我們將 tips 資料集和列 tip、total_bill 和 sex 傳遞給要繪製的 barplot 方法,並將樣式設定為 ticks,在這種情況下,調色盤選擇為 dark
import seaborn as sns
import matplotlib.pyplot as plt
tips=sns.load_dataset("tips")
tips.head()
sns.set_theme(style="ticks", palette="dark")
sns.barplot(data=tips,x="tip" ,y="total_bill",hue="sex")
plt.show()
輸出
獲得的輸出圖如下:
示例 3
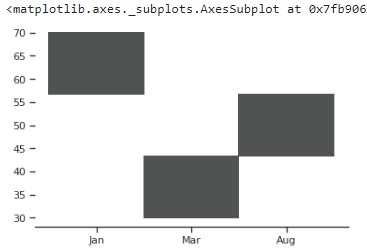
在本例中,設定自定義引數並將這些引數傳遞給 set_theme() 方法,然後繪製圖形以檢視對主題所做的更改。
自定義引數在具有鍵值對的字典中初始化,如下所示。
import seaborn as sns
import matplotlib.pyplot as plt
tips=sns.load_dataset("tips")
tips.head()
custom_params = {"axes.spines.right": False, "axes.spines.top": False,"axes.spines.left":False}
sns.set_theme(style="ticks", palette="light:#5A9",rc=custom_params,color_codes=True)
sns.histplot(x=["Jan", "Mar", "Aug"], y=[70, 30, 50])
plt.show()
輸出
獲得的繪圖如下: