- Seaborn 教程
- Seaborn - 首頁
- Seaborn - 簡介
- Seaborn - 環境設定
- 匯入資料集和庫
- Seaborn - 圖形美學
- Seaborn - 調色盤
- Seaborn - 直方圖
- Seaborn - 核密度估計
- 視覺化成對關係
- Seaborn - 繪製分類資料
- 觀測值的分佈
- Seaborn - 統計估計
- Seaborn - 繪製寬格式資料
- 多面板分類圖
- Seaborn - 線性關係
- Seaborn - Facet Grid
- Seaborn - Pair Grid
- 函式參考
- Seaborn - 函式參考
- Seaborn 有用資源
- Seaborn - 快速指南
- Seaborn - 有用資源
- Seaborn - 討論
Seaborn - 圖形美學
視覺化資料是一個步驟,進一步使視覺化資料更美觀是另一個步驟。視覺化在將定量見解傳達給受眾以吸引他們的注意力方面起著至關重要的作用。
美學是指一組與美本質和欣賞相關的原則,尤其是在藝術中。視覺化是一種以有效且最簡單的方式表示資料的藝術。
Matplotlib 庫高度支援自定義,但要了解哪些設定需要調整才能獲得有吸引力和預期的繪圖,這是人們應該注意以利用它的。與 Matplotlib 不同,Seaborn 隨附自定義主題和用於自定義和控制 Matplotlib 圖形外觀的高階介面。
示例
import numpy as np
from matplotlib import pyplot as plt
def sinplot(flip = 1):
   x = np.linspace(0, 14, 100)
   for i in range(1, 5):
      plt.plot(x, np.sin(x + i * .5) * (7 - i) * flip)
sinplot()
plt.show()
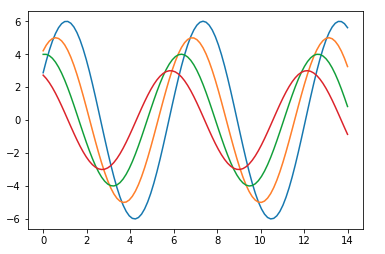
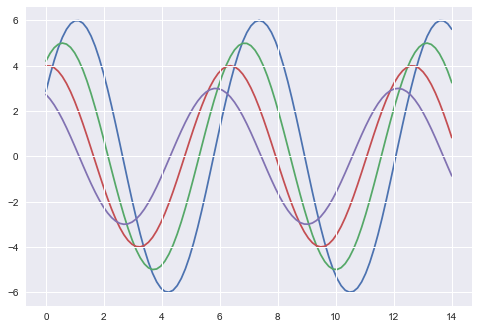
以下是使用預設 Matplotlib 的繪圖外觀 -
要將相同的繪圖更改為 Seaborn 預設值,請使用set()函式 -
示例
import numpy as np
from matplotlib import pyplot as plt
def sinplot(flip = 1):
   x = np.linspace(0, 14, 100)
   for i in range(1, 5):
      plt.plot(x, np.sin(x + i * .5) * (7 - i) * flip)
import seaborn as sb
sb.set()
sinplot()
plt.show()
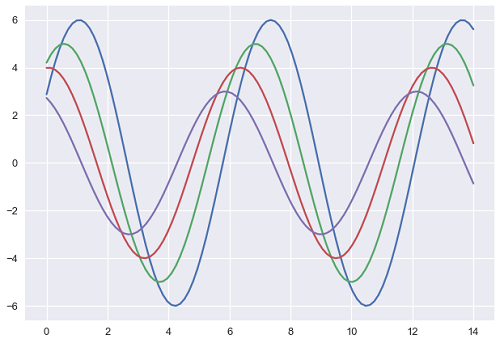
輸出
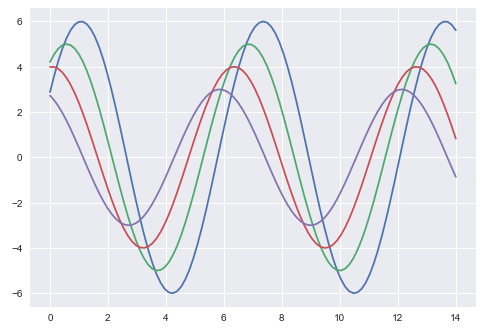
以上兩幅圖顯示了預設 Matplotlib 和 Seaborn 繪圖的差異。資料的表示方式相同,但兩種表示風格都不同。
基本上,Seaborn 將 Matplotlib 引數分為兩組 -
- 繪圖樣式
- 繪圖比例
Seaborn 圖形樣式
操縱樣式的介面是set_style()。使用此函式,您可以設定繪圖的主題。根據最新更新的版本,以下是可用的五個主題。
- 暗網格
- 白網格
- 暗色
- 白色
- 刻度
讓我們嘗試應用上面列出的主題之一。繪圖的預設主題將是暗網格,我們在前面的示例中已經看到過。
示例
import numpy as np
from matplotlib import pyplot as plt
def sinplot(flip=1):
   x = np.linspace(0, 14, 100)
   for i in range(1, 5):
      plt.plot(x, np.sin(x + i * .5) * (7 - i) * flip)
import seaborn as sb
sb.set_style("whitegrid")
sinplot()
plt.show()
輸出
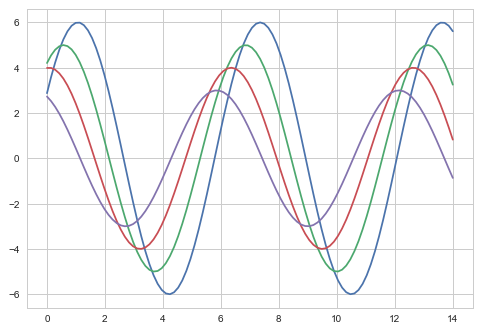
以上兩幅圖的區別在於背景顏色
移除座標軸脊
在白色和刻度主題中,我們可以使用despine()函式移除頂部和右側座標軸脊。
示例
import numpy as np
from matplotlib import pyplot as plt
def sinplot(flip=1):
   x = np.linspace(0, 14, 100)
   for i in range(1, 5):
      plt.plot(x, np.sin(x + i * .5) * (7 - i) * flip)
import seaborn as sb
sb.set_style("white")
sinplot()
sb.despine()
plt.show()
輸出
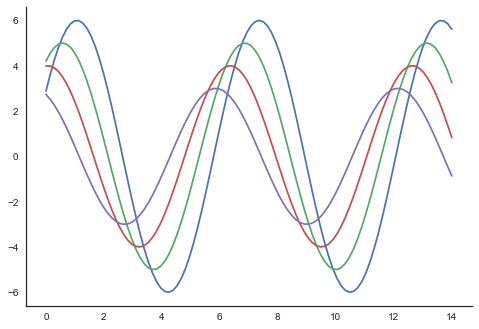
在常規繪圖中,我們僅使用左側和底部座標軸。使用despine()函式,我們可以避免不必要的右側和頂部座標軸脊,這在 Matplotlib 中不受支援。
覆蓋元素
如果要自定義 Seaborn 樣式,可以將引數字典傳遞給set_style()函式。可用的引數可以使用axes_style()函式檢視。
示例
import seaborn as sb
print sb.axes_style
輸出
{'axes.axisbelow'     : False,
'axes.edgecolor'      : 'white',
'axes.facecolor'      : '#EAEAF2',
'axes.grid'           : True,
'axes.labelcolor'     : '.15',
'axes.linewidth'      : 0.0,
'figure.facecolor'    : 'white',
'font.family'         : [u'sans-serif'],
'font.sans-serif'     : [u'Arial', u'Liberation
                        Sans', u'Bitstream Vera Sans', u'sans-serif'],
'grid.color'          : 'white',
'grid.linestyle'      : u'-',
'image.cmap'          : u'Greys',
'legend.frameon'      : False,
'legend.numpoints'    : 1,
'legend.scatterpoints': 1,
'lines.solid_capstyle': u'round',
'text.color'          : '.15',
'xtick.color'         : '.15',
'xtick.direction'     : u'out',
'xtick.major.size'    : 0.0,
'xtick.minor.size'    : 0.0,
'ytick.color'         : '.15',
'ytick.direction'     : u'out',
'ytick.major.size'    : 0.0,
'ytick.minor.size'    : 0.0}
更改任何引數的值都會更改繪圖樣式。
示例
import numpy as np
from matplotlib import pyplot as plt
def sinplot(flip=1):
   x = np.linspace(0, 14, 100)
   for i in range(1, 5):
      plt.plot(x, np.sin(x + i * .5) * (7 - i) * flip)
import seaborn as sb
sb.set_style("darkgrid", {'axes.axisbelow': False})
sinplot()
sb.despine()
plt.show()
輸出
縮放繪圖元素
我們還可以控制繪圖元素,並可以使用set_context()函式控制繪圖的比例。我們有四個預設的上下文模板,基於相對大小,上下文命名如下
- 紙張
- 筆記本
- 演講
- 海報
預設情況下,上下文設定為筆記本;並在上面的繪圖中使用。
示例
import numpy as np
from matplotlib import pyplot as plt
def sinplot(flip = 1):
   x = np.linspace(0, 14, 100)
   for i in range(1, 5):
      plt.plot(x, np.sin(x + i * .5) * (7 - i) * flip)
import seaborn as sb
sb.set_style("darkgrid", {'axes.axisbelow': False})
sinplot()
sb.despine()
plt.show()
輸出
與上面的繪圖相比,實際繪圖的輸出尺寸更大。
注意 - 由於我們在網頁上縮放影像,您可能會錯過我們示例繪圖中的實際差異。