- Seaborn 教程
- Seaborn - 首頁
- Seaborn - 簡介
- Seaborn - 環境設定
- 匯入資料集和庫
- Seaborn - 圖形美觀
- Seaborn - 調色盤
- Seaborn - 直方圖
- Seaborn - 核密度估計
- 視覺化成對關係
- Seaborn - 繪製分類資料
- 觀測值的分佈
- Seaborn - 統計估計
- Seaborn - 繪製寬格式資料
- 多面板分類圖
- Seaborn - 線性關係
- Seaborn - Facet Grid
- Seaborn - Pair Grid
- 函式參考
- Seaborn - 函式參考
- Seaborn 有用資源
- Seaborn - 快速指南
- Seaborn - 有用資源
- Seaborn - 討論
Seaborn.set_style() 方法
Seaborn.set_style() 方法設定控制繪圖整體風格的引數。此方法與 seaborn.axes_style() 方法緊密配合,因為它也檢查網格是否預設啟用,並使用其樣式引數控制各種屬性,例如背景顏色等。
可以透過 matplotlib rcParams 系統設定這些引數來控制繪圖的整體樣式。
語法
以下是 seaborn.set_style() 方法的語法:
seaborn.set_style(style=None, rc=None)
引數
以下是 seaborn.set_style() 方法的引數:
| 序號 | 引數及描述 |
|---|---|
| 1 | 樣式 取值可以是 None、字典或 {darkgrid, whitegrid, dark, white, ticks} 中的一個,並確定引數字典或預配置樣式的名稱。 |
| 2 | Rc 取值為 rcdict,是一個可選引數,用於執行引數對映以覆蓋預設 seaborn 樣式字典中的值。這隻會更新被視為樣式定義一部分的引數。 |
現在我們將繼續瞭解該方法並在示例中使用它。
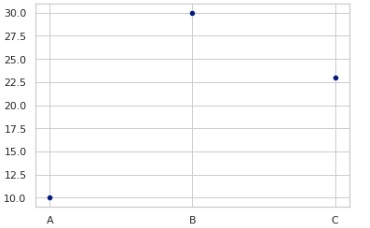
示例 1
樣式設定為“whitegrid”,並使用值列表繪製散點圖。獲得的繪圖如下所示。
import seaborn as sns
import matplotlib.pyplot as plt
tips=sns.load_dataset("tips")
tips.head()
sns.set_style("whitegrid")
sns.scatterplot(x=["A", "B", "C"], y=[10, 30, 23])
plt.show()
輸出
圖形如下所示:
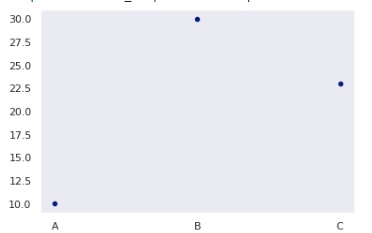
示例 2
在這個示例中,我們將看到另一種樣式。dark 是一種可以設定的樣式,獲得的繪圖將如下所示。
import seaborn as sns
import matplotlib.pyplot as plt
tips=sns.load_dataset("tips")
tips.head()
sns.set_style("dark")
sns.scatterplot(x=["A", "B", "C"], y=[10, 30, 23])
plt.show()
輸出
獲得的輸出為:
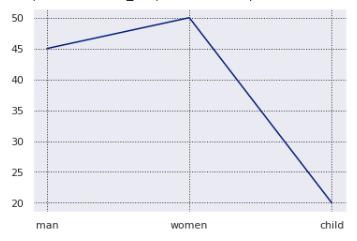
示例 3
在這個示例中,我們將看到在設定樣式時如何更改網格顏色和網格線樣式。您需要像下面這樣初始化它們,獲得的圖形將發生變化。
import seaborn as sns
import matplotlib.pyplot as plt
tips=sns.load_dataset("tips")
tips.head()
sns.set_style("darkgrid", {"grid.color": ".2", "grid.linestyle": ":"})
sns.lineplot(x=["man", "women", "child"], y=[45, 50, 20])
plt.show()
輸出
獲得的輸出如下所示:
seaborn_themeing_introduction.htm
廣告