- Seaborn 教程
- Seaborn - 首頁
- Seaborn - 簡介
- Seaborn - 環境設定
- 匯入資料集和庫
- Seaborn - 圖表美學
- Seaborn - 調色盤
- Seaborn - 直方圖
- Seaborn - 核密度估計
- 視覺化成對關係
- Seaborn - 繪製分類資料
- 觀測值的分佈
- Seaborn - 統計估計
- Seaborn - 繪製寬格式資料
- 多面板分類圖
- Seaborn - 線性關係
- Seaborn - Facet Grid
- Seaborn - Pair Grid
- 函式參考
- Seaborn - 函式參考
- Seaborn 有用資源
- Seaborn - 快速指南
- Seaborn - 有用資源
- Seaborn - 討論
Seaborn.set_color_codes() 方法
Seaborn.set_color_codes() 方法用於更改 matplotlib 顏色縮寫 的解釋方式。呼叫此方法將改變 matplotlib 在後續繪圖中對諸如“b”或“g”之類的縮寫程式碼的解釋方式。
Matplotlib 顏色縮寫不過是用於表示顏色的快捷方式。例如,單字元縮寫用於表示基本顏色,例如藍色('b')、綠色('g')、紅色('r')、黃色('y')等。
語法
以下是 seaborn.set_color_codes() 方法的語法:
seaborn.set_color_codes(palette='deep')
引數
此方法只有一個引數,解釋如下。
| 序號 | 引數及描述 |
|---|---|
| 1 | palette 取值範圍為 {deep, muted, pastel, dark, bright, colorblind},用於指定用作顏色來源的 seaborn 調色盤名稱。 |
在我們進入示例之前,我們將瞭解如何從 seaborn 庫載入資料集。
載入 seaborn 庫
要載入或匯入 seaborn 庫,可以使用以下程式碼行。
Import seaborn as sns
載入資料集
在本文中,我們將使用 seaborn 庫中內建的 Tips 資料集。使用以下命令載入資料集。
tips=sns.load_dataset("tips")
以下命令用於檢視資料集中前 5 行。這使我們能夠了解可以使用哪些變數來繪製圖表。
tips.head()
以下是上述程式碼的輸出。
index,total_bill,tip,sex,smoker,day,time,size
0,16.99,1.01,Female,No,Sun,Dinner,2
1,10.34,1.66,Male,No,Sun,Dinner,3
2,21.01,3.5,Male,No,Sun,Dinner,3
3,23.68,3.31,Male,No,Sun,Dinner,2
4,24.59,3.61,Female,No,Sun,Dinner,4
現在我們已經載入了資料,我們將在接下來的示例中瞭解該方法的工作原理。
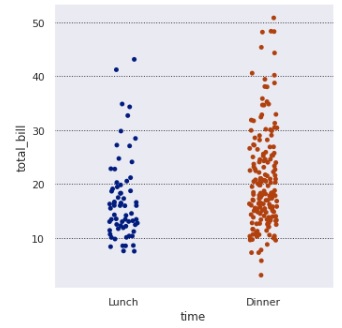
示例 1
在這個示例中,我們將瞭解如何使用 seaborn 的 set_color_codes() 方法並向其傳遞引數。稍後我們將繪製圖表以使用設定的顏色程式碼。我們在本例中使用 tips 資料集,並在設定顏色程式碼後繪製分類圖。
import seaborn as sns
import matplotlib.pyplot as plt
tips=sns.load_dataset("tips")
tips.head()
sns.set_color_codes("dark")
sns.catplot(data=tips,x="time",y="total_bill")
plt.show()
輸出
生成的輸出如下所示:
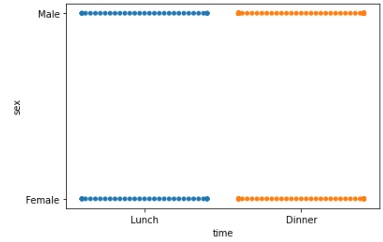
示例 2
我們將向 set_color_codes() 方法傳遞另一個值,並檢視圖表是如何變化的。這裡,“dark”作為引數傳遞,之後繪製圖表以檢視圖表顏色程式碼是如何變化的。
import seaborn as sns
import matplotlib.pyplot as plt
tips=sns.load_dataset("tips")
tips.head()
sns.set_color_codes("dark")
sns.swarmplot(data=tips,x="time",y="sex")
plt.show()
輸出
獲得的輸出如下:
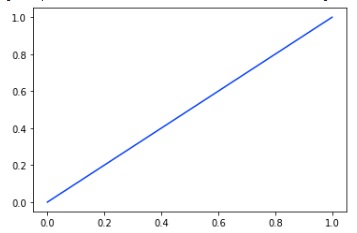
示例 3
我們使用 matplotlib pyplot 方法而不是 seaborn 方法繪製圖表並傳遞資料集。透過這種方式,我們可以理解 seaborn 方法適用於所有型別的圖表,而不僅僅是 seaborn 圖表。在本例中,顏色程式碼設定為 bright,下面附上獲得的圖表。
import seaborn as sns
import matplotlib.pyplot as plt
tips=sns.load_dataset("tips")
tips.head()
sns.set_color_codes("bright")
plt.plot([0, 1], color="b")
plt.show()
輸出
輸出如下:
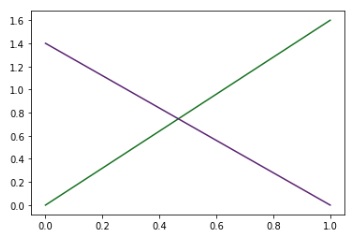
示例 4
在本例中,我們將顏色程式碼設定為 dark,然後使用 matplotlib pyplot 方法繪製圖表並將顏色設定為綠色和紫色。為此要傳遞給 color 引數的變數是 g(綠色)和 m(紫色)。
import seaborn as sns
import matplotlib.pyplot as plt
tips=sns.load_dataset("tips")
tips.head()
sns.set_color_codes("dark")
_ = plt.plot([0, 1.6], color="g")
_ = plt.plot([1.4, 0], color="m")
plt.show()
輸出
獲得的圖表如下: