
 資料結構
資料結構 網路
網路 關係資料庫管理系統
 作業系統
作業系統 Java
Java iOS
iOS HTML
HTML CSS
CSS Android
 Python
 C 程式設計
 C++
C++ C#
C# MongoDB
 MySQL
MySQL Javascript
 PHP
PHP在 Matplotlib 中使用 plot、axes 或 figure 繪製圖形有什麼區別?
讓我們透過一個例子來了解 plot、axes 和 figure 之間的區別。
Plot − Plot 用於繪製單個具有 (x, y) 座標的圖表。
Axes − Axes 用於在同一視窗中繪製一個或多個圖表,並設定圖表的定位。
Figure − 此方法為所有繪圖元素提供一個頂級容器。
我們可以按照以下步驟來複制它們之間的差異:
使用 plt.figure() 建立一個新圖形或啟用一個現有圖形。
使用 plt.add_subplot(xyz) 將軸新增到圖形作為子圖排列的一部分,其中 x 是行數,y 是列數,z 是索引。這裡取 x = 1(行),y = 2(列)和 z = 1(位置)。
透過將列表傳遞到 plt.plot() 方法中來繪製線條。
要顯示圖表,請使用 plt.show() 方法。
示例
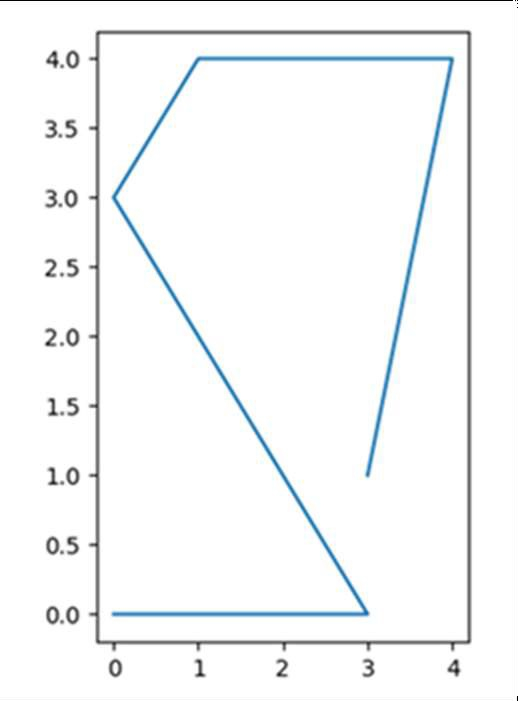
我們將在以下程式碼中使用 plot、axes 和 figure:
import matplotlib.pyplot as plt

fig = plt.figure()             # Activating figure

ax1 = fig.add_subplot(121)     # Setting up figure position

plt.plot([3, 4, 1, 0, 3, 0], [1, 4, 4, 3, 0, 0]) # Drawing lines in the
activated figure.

plt.show()
輸出

更新於: 2021年3月15日
3K+ 次檢視

廣告