
 資料結構
資料結構 網路
網路 RDBMS
RDBMS 作業系統
作業系統 Java
Java iOS
iOS HTML
HTML CSS
CSS Android
 Python
 C 程式設計
 C++
C++ C#
C# MongoDB
 MySQL
MySQL Javascript
 PHP
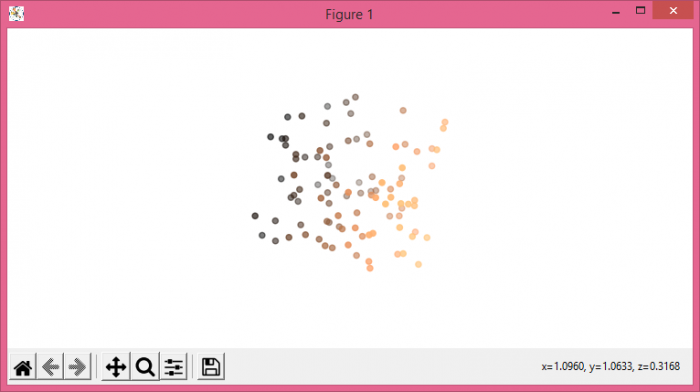
PHP在 Matplotlib 中繪製無軸無網格的三維散點圖
要在 matplotlib 中繪製無軸的三維散點圖,我們可以使用 scatter() 方法,並關閉軸。
步驟
- 設定圖表大小並調整子圖之間的和周圍的填充。
- 使用 figure() 方法建立一個新圖表或啟用現有圖表。
- 新增一個軸作為子圖排列。
- 使用 numpy 建立 xs、ys 和 zs 資料點。
- 使用 scatter() 方法來建立散點圖。
- 使用 ax.axis('off') 方法隱藏軸。
- 要顯示圖表,請使用 show() 方法。
示例
import numpy as np
from matplotlib import pyplot as plt
plt.rcParams["figure.figsize"] = [7.50, 3.50]
plt.rcParams["figure.autolayout"] = True
fig = plt.figure()
ax = fig.add_subplot(projection="3d")
xs = np.random.rand(100)
ys = np.random.rand(100)
zs = np.random.rand(100)
ax.scatter(xs, ys, zs, c=xs, cmap="copper")
ax.axis('off')
plt.show()
輸出

更新時間: 2021 年 6 月 1 日
739 次瀏覽

廣告