
 資料結構
資料結構 網路技術
網路技術 關係資料庫管理系統
 作業系統
作業系統 Java
Java iOS
iOS HTML
HTML CSS
CSS Android
 Python
 C 程式設計
 C++
C++ C#
C# MongoDB
 MySQL
MySQL JavaScript
 PHP
PHP如何在 Matplotlib 中的散點圖頂部繪製其他點?
要在 Matplotlib 的散點圖頂部繪製其他點,我們可以採取以下步驟 −
步驟
設定圖形尺寸並調整子圖之間和周圍的留白。
建立 x 和 y 資料點的列表。
使用 x 和 y 資料點建立一個散點圖。
使用 marker='*' 繪製其他點
使用 show() 方法顯示該圖形。
示例
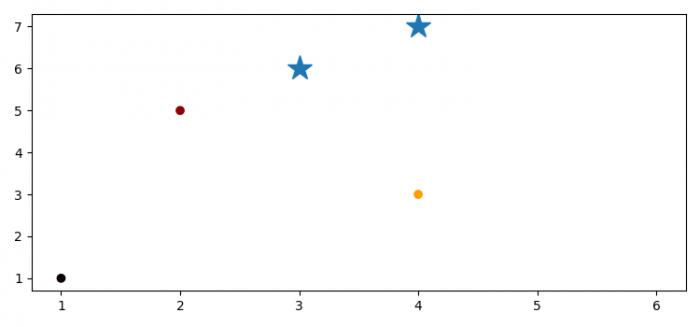
from matplotlib import pyplot as plt

# Set the figure size
plt.rcParams["figure.figsize"] = [7.50, 3.50]
plt.rcParams["figure.autolayout"] = True

# List of data points
x = [1, 2, 6, 4]
y = [1, 5, 2, 3]

# Scatter plot with x and y
plt.scatter(x, y, c=x, cmap='hot')

plt.plot([3, 4], [6, 7], marker='*', ls='none', ms=20)

# Display the plot
plt.show()
輸出
它將產生以下輸出 −

更新於: 2022 年 2 月 2 日
17K+ 瀏覽量

廣告