
 資料結構
資料結構 網路
網路 RDBMS
RDBMS 作業系統
作業系統 Java
Java iOS
iOS HTML
HTML CSS
CSS Android
 Python
 C 程式設計
 C++
C++ C#
C# MongoDB
 MySQL
MySQL JavaScript
 PHP
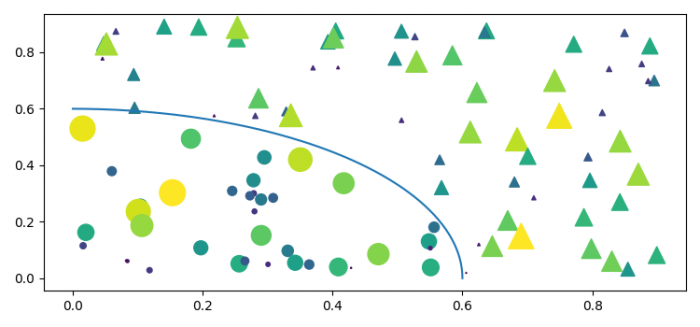
PHP如何在 Matplotlib 中繪製分散掩碼點並新增一條線標出掩碼區域?
為了繪製分散的掩碼點並新增一條線,以標出掩碼區域,我們可以採取以下步驟。
步驟
- 設定圖片大小,並調整子圖片之間及周圍的填充。
- 使用 numpy 建立N、r0、x、y、area、c、r、area1和area2資料點。
- 使用scatter()方法繪製x和y資料點。
- 為了標出掩碼區域,使用plot()方法繪製曲線。
- 使用show()方法顯示圖形。
示例
import matplotlib.pyplot as plt
import numpy as np

plt.rcParams["figure.figsize"] = [7.50, 3.50]
plt.rcParams["figure.autolayout"] = True

N = 100
r0 = 0.6
x = 0.9 * np.random.rand(N)
y = 0.9 * np.random.rand(N)
area = (20 * np.random.rand(N))**2
c = np.sqrt(area)

r = np.sqrt(x ** 2 + y ** 2)
area1 = np.ma.masked_where(r < r0, area)
area2 = np.ma.masked_where(r >= r0, area)
plt.scatter(x, y, s=area1, marker='^', c=c)
plt.scatter(x, y, s=area2, marker='o', c=c)
theta = np.arange(0, np.pi / 2, 0.01)
plt.plot(r0 * np.cos(theta), r0 * np.sin(theta))

plt.show()
輸出

更新於: 2021 年 6 月 10 日
330 次瀏覽

廣告