
 資料結構
資料結構 網路
網路 RDBMS
RDBMS 作業系統
作業系統 Java
Java iOS
iOS HTML
HTML CSS
CSS Android
 Python
 C 語言
C 語言 C++
C++ C#
C# MongoDB
 MySQL
MySQL Javascript
 PHP
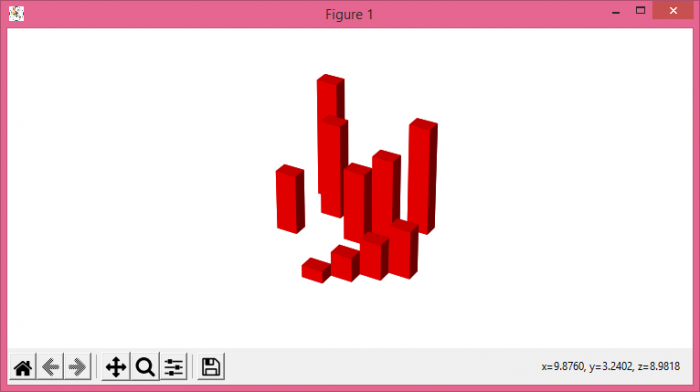
PHP在 Matplotlib 中繪製無軸 3D 條形圖
要繪製無軸 3D 條形圖,我們可以按照以下步驟操作
- 設定圖的大小並調整子圖的間距和周圍的間距。
- 使用 figure() 方法建立一個新圖或啟用現有圖。
- 將一個軸新增到當前圖中作為子圖排列。
- 使用 numpy 建立 x3、y3 和 z3 資料點。
- 使用 numpy 建立 dx、dy 和 dz 資料點。
- 使用 bar3d() 方法繪製 3D 條形圖。
- 要隱藏軸,請按名稱使用 axis('off') 類。
- 要顯示圖,請使用 show() 方法。
例項
import numpy as np
from matplotlib import pyplot as plt
plt.rcParams["figure.figsize"] = [7.50, 3.50]
plt.rcParams["figure.autolayout"] = True
fig = plt.figure()
ax1 = fig.add_subplot(111, projection='3d')
x3 = [1, 2, 3, 4, 5, 6, 7, 8, 9, 10]
y3 = [5, 6, 7, 8, 2, 5, 6, 3, 7, 2]
z3 = np.zeros(10)
dx = np.ones(10)
dy = np.ones(10)
dz = [1, 2, 3, 4, 5, 6, 7, 8, 9, 10]
ax1.bar3d(y3, x3, z3, dx, dy, dz, color="red")
ax1.axis('off')
plt.show()
輸出

更新於: 2021 年 6 月 1 日
364 次瀏覽

廣告