
 資料結構
資料結構 網路
網路 RDBMS
RDBMS 作業系統
作業系統 Java
Java iOS
iOS HTML
HTML CSS
CSS Android
 Python
 C 程式設計
 C++
C++ C#
C# MongoDB
 MySQL
MySQL Javascript
 PHP
PHP如何在 Matplotlib 中繪製 3D 軸線上的一個點?
要在 Matplotlib 中繪製 3D 軸線上的一個點,我們可以採取以下步驟 -
設定圖形大小並調整子圖之間和子圖周圍的邊距。
使用 figure() 方法建立新圖形或啟用現有圖形。
將軸線作為子圖佈置的一部分新增到圖形中,並設定 3D 投影。
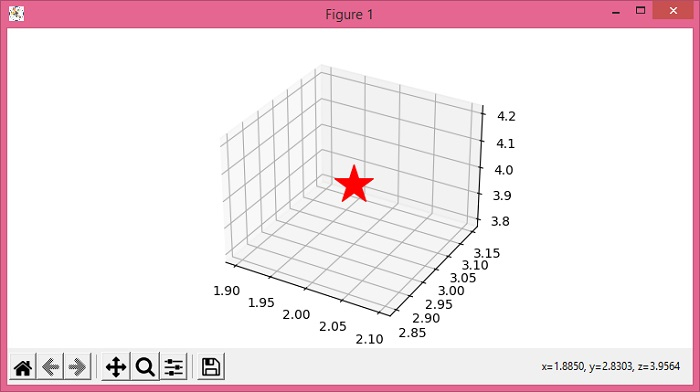
要繪製 3D 軸線上的點,請使用 scatter() 方法。
要顯示圖形,請使用 show() 方法。
示例
from matplotlib import pyplot as plt

plt.rcParams["figure.figsize"] = [7.50, 3.50]
plt.rcParams["figure.autolayout"] = True

fig = plt.figure()
ax = fig.add_subplot(111, projection='3d')

ax.scatter(2, 3, 4, c='red', marker='*', s=1000)

plt.show()
輸出

更新於: 03-06-2021
6K+ 瀏覽

廣告