
 資料結構
資料結構 網路
網路 RDBMS
RDBMS 作業系統
作業系統 Java
Java iOS
iOS HTML
HTML CSS
CSS Android
 Python
 C 程式設計
 C++
C++ C#
C# MongoDB
 MySQL
MySQL Javascript
 PHP
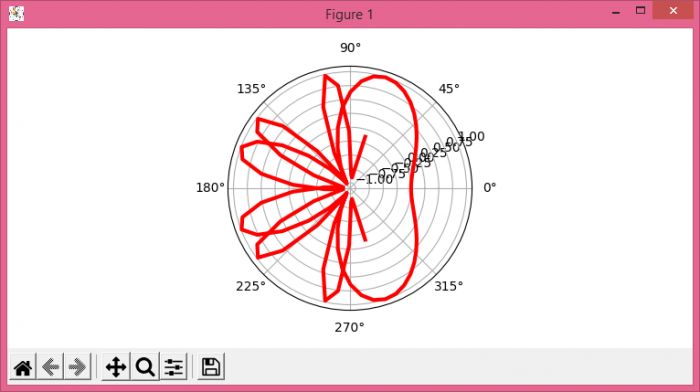
PHP如何使用 Matplotlib 在極座標軸上繪製正弦曲線?
要繪製極座標軸上的正弦曲線,我們可以採取以下步驟 -
- 設定圖形大小和調整子圖之間及其周圍的填充。
- 使用 figure() 方法建立新圖形或啟用現有圖形
- 將 '~.axes.Axes' 作為子圖排列的一部分新增到圖形中。
- 使用 numpy 獲取 x 和 y 資料點。
- 使用 plot() 方法繪製 x 和 y 資料點。
- 使用 show() 方法顯示圖形。
示例
import numpy as np
import matplotlib.pyplot as plt

plt.rcParams["figure.figsize"] = [7.50, 3.50]
plt.rcParams["figure.autolayout"] = True

fig = plt.figure()
ax = fig.add_subplot(projection='polar')

x = np.linspace(-5, 5, 100)
y = np.sin(x**2)

ax.plot(x, y, color='red', lw=3)

plt.show()
輸出

更新於: 18-06-2021
612 閱讀

廣告