
 資料結構
資料結構 網路
網路 關係型資料庫管理系統
 作業系統
作業系統 Java
Java iOS
iOS HTML
HTML CSS
CSS Android
 Python
 C 語言
C 語言 C++
C++ C#
C# MongoDB
 MySQL
MySQL Javascript
 PHP
PHP如何在 Matplotlib 中繪製半幅或四分之一極座標圖?
要在 Matplotlib 中繪製半幅或四分之一極座標圖,我們可以按照以下步驟操作 −
設定圖形大小,並調整子圖之間和周圍的邊距。
建立新圖形或使用 figure() 方法啟用現有圖形。
將軸作為子圖排列的一部分新增到圖形中。
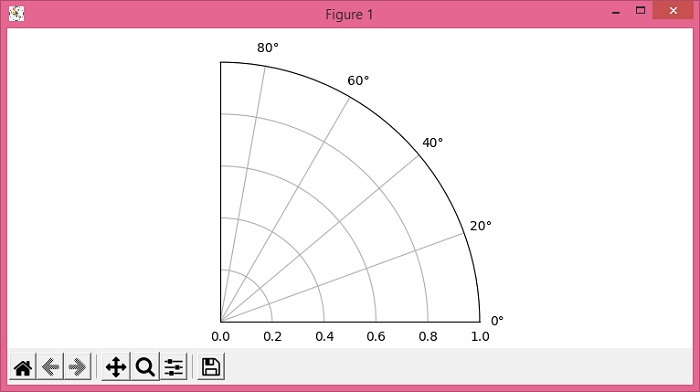
對於半幅或四分之一極座標圖,使用 set_thetamax() 方法。
要顯示圖形,請使用 show() 方法。
示例
from matplotlib import pyplot as plt

plt.rcParams["figure.figsize"] = [7.50, 3.50]
plt.rcParams["figure.autolayout"] = True

fig = plt.figure()
ax = fig.add_subplot(111, projection="polar")
max_theta = 90
ax.set_thetamax(max_theta)
plt.show()
輸出

更新於: 03-6 月-2021
超過 1K 次瀏覽

廣告