
 資料結構
資料結構 網路
網路 關係資料庫管理系統
 作業系統
作業系統 Java
Java iOS
iOS HTML
HTML CSS
CSS Android
 Python
 C 程式設計
 C++
C++ C#
C# MongoDB
 MySQL
MySQL Javascript
 PHP
PHP在 Matplotlib 中繪製多個繪圖
Python 提供了一個名為 Matplotlib 的強大庫,該庫以繪圖和圖形的形式建立視覺表示。該庫的眾多功能之一是能夠在一個圖形中繪製多個繪圖,這在比較不同的資料集或視覺化多個變數之間的關係時非常有用。我們將探索 Matplotlib 的名為“subplots()”的內建方法,該方法用於繪製多個繪圖。
在 Matplotlib 中繪製多個繪圖的 Python 程式
在直接跳到程式之前,讓我們先熟悉一下 Matplotlib 的 subplots() 方法。
subplots() 方法
透過一次呼叫“subplots()”方法,我們可以在單個圖形中建立一個或多個子圖。它提供了對繪圖的適當控制,並且還允許我們自定義其佈局和外觀。
語法
subplots(numOfrows, numOfcols)
這裡,'numOfrows' 和 'numOfcols' 分別指定網格的行數和列數。
但是,我們也可以根據需要新增一些其他屬性。
示例 1
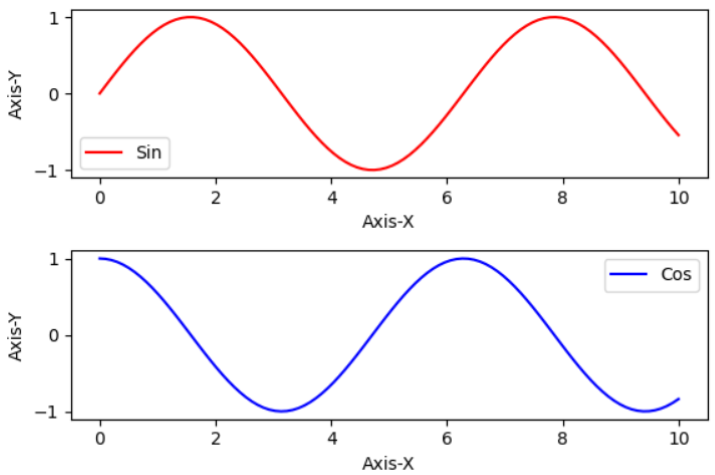
在以下示例中,我們將繪製正弦和餘弦函式的兩個子圖。
方法
首先,我們將匯入 matplotlib 和 numpy。matplotlib 將用於視覺化 numpy 生成的資料。
使用 NumPy 的內建方法“linspace()”生成一個從 0 到 10 之間 100 個等間距值的陣列。然後,計算 x 陣列中每個元素的正弦和餘弦值,並將它們分別儲存在 y1 和 y2 中。
現在,使用“subplots()”方法建立兩個垂直排列的子圖。此方法將返回一個名為“fig”的圖形物件和一個子圖軸“ax1”和“ax2”的元組。這裡,“figsize”設定圖形的大小。
在第一個子圖 ax1 上繪製 x 值相對於 y1 值的圖形。
同樣,在第二個子圖 ax2 上繪製 x 值相對於 y2 值的圖形。
使用“tight_layout()”方法調整子圖之間的間距,以防止重疊。
最後,顯示繪圖並退出。
import matplotlib.pyplot as plt
import numpy as np
# generating some random data for plotting
val = np.linspace(0, 10, 100)
pl1 = np.sin(val)
pl2 = np.cos(val)
# Creating subplots
fig, (axs1, axs2) = plt.subplots(2, 1, figsize = (6, 4))
# Plotting of the first subplot
axs1.plot(val, pl1, 'r', label = 'Sin')
axs1.set_xlabel('Axis-X')
axs1.set_ylabel('Axis-Y')
axs1.legend()
# Plotting of the second subplot
axs2.plot(val, pl2, 'b', label = 'Cos')
axs2.set_xlabel('Axis-X')
axs2.set_ylabel('Axis-Y')
axs2.legend()
# for adjusting the space between subplots
plt.tight_layout()
# to display the plots
plt.show()
輸出
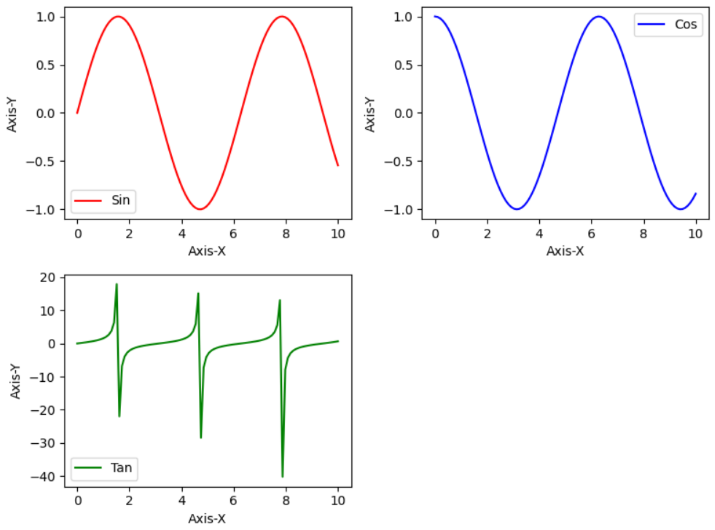
示例 2
在以下示例中,我們將更改先前示例的程式碼以新增一個正切函式的繪圖。
import matplotlib.pyplot as plt
import numpy as np
# generating some random data for plotting
val = np.linspace(0, 10, 100)
pl1 = np.sin(val)
pl2 = np.cos(val)
pl3 = np.tan(val)
# Creating the subplots using above data
fig, axs = plt.subplots(2, 2, figsize = (8, 6))
# Plotting of the first subplot
axs[0, 0].plot(val, pl1, 'r', label = 'Sin')
axs[0, 0].set_xlabel('Axis-X')
axs[0, 0].set_ylabel('Axis-Y')
axs[0, 0].legend()
# To plot on the second subplot
axs[0, 1].plot(val, pl2, 'b', label = 'Cos')
axs[0, 1].set_xlabel('Axis-X')
axs[0, 1].set_ylabel('Axis-Y')
axs[0, 1].legend()
# Plotting of the third subplot
axs[1, 0].plot(val, pl3, 'g', label = 'Tan')
axs[1, 0].set_xlabel('Axis-X')
axs[1, 0].set_ylabel('Axis-Y')
axs[1, 0].legend()
# To remove the empty subplot
fig.delaxes(axs[1, 1])
# for adjusting the space between subplots
plt.tight_layout()
# Displaying all plots
plt.show()
輸出
結論
我們從介紹 Matplotlib 及其內建方法“subplots()”開始本文。在下一節中,我們將詳細解釋此方法。此外,我們還討論了兩個示例程式以展示“subplots()”方法在繪製多個繪圖中的用法。

3K+ 瀏覽量
