
 資料結構
資料結構 網路
網路 關係型資料庫管理系統
 作業系統
作業系統 Java
Java iOS
iOS HTML
HTML CSS
CSS Android
 Python
 C 程式設計
 C++
C++ C#
C# MongoDB
 MySQL
MySQL Javascript
 PHP
PHP在 Matplotlib 中繪製多條線
Python 提供了一個名為 Matplotlib 的強大庫,該庫以圖表和圖形的形式建立視覺表示。該庫的眾多功能之一是在單個圖形中繪製多條線的能力,這在比較資料集或視覺化隨時間推移的趨勢時非常有用。我們將探討名為“plot()”的內建方法,該方法用於在 Python Matplotlib 中繪製多條線。
Python 程式在 Matplotlib 中繪製多條線
在直接跳轉到程式之前,讓我們先熟悉一些 Python 的基本概念,這將有助於我們更好地理解程式碼。
plot() 方法
此方法用於建立各種型別的繪圖,並具有不同的樣式和格式。它接受一個或多個表示繪圖上 x 和 y 座標的對。預設情況下,它繪製從一個數據點到另一個數據點的線。但是,我們可以透過更改格式字串或使用其他引數(如顏色和線型)來繪製其他型別的繪圖,例如散點圖、條形圖和直方圖。
語法
plot(x, y)
這裡,x 和 y 指定 x 和 y 座標的資料點。
Numpy
它是 Numerical Python 的簡稱,用於執行科學計算。它提供對處理大型多維陣列和矩陣的支援。我們可以輕鬆地將其與其他使用陣列的 Python 庫(如 pandas 和 matplotlib)整合。
字典
它是一個無序且可變的元素集合。它以鍵值對的形式儲存其元素,其中每個鍵都與一個值相關聯。我們可以透過將元素放在花括號“{ }”中作為“鍵”:“值”來建立字典,並用逗號分隔每個鍵值對。
示例
Details = {"Tutor" : "Tutorialspoint", "Rank" : 01, "country" : "India"}
示例 1
以下示例說明了在繪製多條線時“plot()”方法的使用。
方法
使用資料點列表初始化三條線。
使用“plot()”方法繪製 x 座標的值與 y 座標的值。
然後,使用“title”、“legend”、“xlabel”和“ylabel”新增一些有關繪圖的資訊。
使用“show()”方法顯示結果並退出。
import matplotlib.pyplot as plt
# Data points of line 1
x1 = [1, 2, 3, 4, 5]
y1 = [2, 4, 6, 8, 10]
# Data points of line 2
x2 = [1, 2, 3, 4, 5]
y2 = [1, 3, 5, 7, 9]
# Data points of line 3
x3 = [1, 2, 3, 4, 5]
y3 = [5, 4, 3, 2, 1]
# Plotting all lines with specifying labels
plt.plot(x1, y1, label='Line 1')
plt.plot(x2, y2, label='Line 2')
plt.plot(x3, y3, label='Line 3')
# Adding legend, x and y labels, and titles for the lines
plt.legend()
plt.xlabel('X-axis')
plt.ylabel('Y-axis')
plt.title('Plotting Multiple Lines')
# Displaying the plot
plt.show()
輸出

示例 2
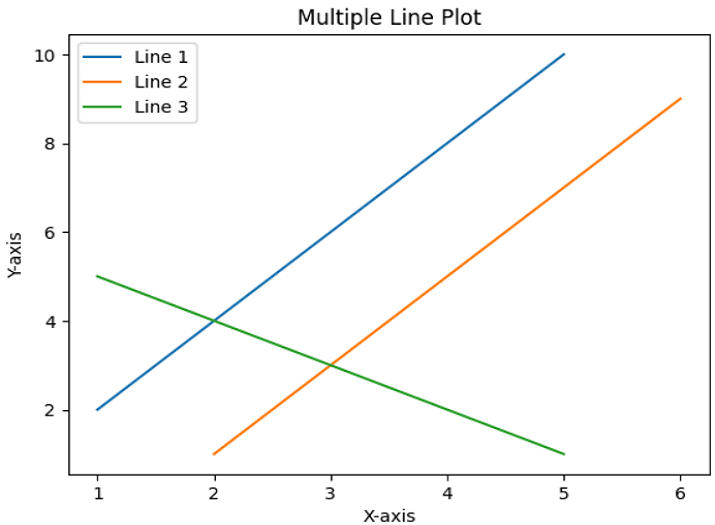
在此示例中,我們將藉助 numpy 和 plot() 方法繪製多條線。在前面示例的相同程式碼中,我們將使用 numpy 陣列而不是列表。
import numpy as np
import matplotlib.pyplot as plt
# Data points of line 1
x1 = np.array([1, 2, 3, 4, 5])
y1 = np.array([2, 4, 6, 8, 10])
# Data points of line 2
x2 = np.array([2, 3, 4, 5, 6])
y2 = np.array([1, 3, 5, 7, 9])
# Data points of line 3
x3 = np.array([1, 2, 3, 4, 5])
y3 = np.array([5, 4, 3, 2, 1])
# Plotting all lines with labels
plt.plot(x1, y1, label='Line 1')
plt.plot(x2, y2, label='Line 2')
plt.plot(x3, y3, label='Line 3')
# Adding legend, x and y labels, and title for the lines
plt.legend()
plt.xlabel('X-axis')
plt.ylabel('Y-axis')
plt.title('Multiple Line Plot')
# Displaying the plot
plt.show()
輸出
示例 3
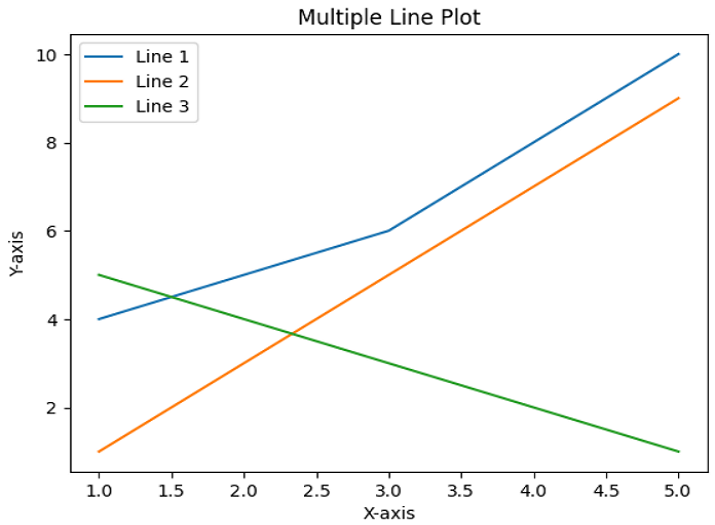
在以下示例中,我們將藉助字典和 plot() 方法繪製多條線。
import matplotlib.pyplot as plt
# Storing the data for line in a Dictionary
lines = {
   'Line 1': ([1, 2, 3, 4, 5], [4, 5, 6, 8, 10]),
   'Line 2': ([1, 2, 3, 4, 5], [1, 3, 5, 7, 9]),
   'Line 3': ([1, 2, 3, 4, 5], [5, 4, 3, 2, 1])
}
# Plotting the lines with labels
for label, (x, y) in lines.items():
   plt.plot(x, y, label = label)
# Adding legend, x and y labels, and title for the lines
plt.legend()
plt.xlabel('X-axis')
plt.ylabel('Y-axis')
plt.title('Multiple Line Plot')
# Displaying the plot
plt.show()
輸出
結論
我們從介紹 Python 的 Matplotlib 庫開始本文,並在後面的部分中學習了“plot()”、numpy 和字典的基本概念,以便更好地理解示例程式。使用這些概念,我們討論瞭如何在單個圖形中繪製多條線。

7K+ 瀏覽量
