
 資料結構
資料結構 網路
網路 RDBMS
RDBMS 作業系統
作業系統 Java
Java iOS
iOS HTML
HTML CSS
CSS Android
 Python
 C程式設計
C程式設計 C++
C++ C#
C# MongoDB
 MySQL
MySQL Javascript
 PHP
PHP在Pandas或Matplotlib中繪製單個圖表中的多個箱線圖
要在Pandas或Matplotlib中的單個圖表中繪製多個箱線圖,我們可以採取以下步驟 -
步驟
設定圖形大小,並調整子圖之間和周圍的填充。
製作一個包含兩列的Pandas資料幀。
使用plot()方法和kind='boxplot'繪製資料幀。
若要顯示圖形,請使用show()方法。
示例
import pandas as pd
import numpy as np
from matplotlib import pyplot as plt
# Set the figure size
plt.rcParams["figure.figsize"] = [7.50, 3.50]
plt.rcParams["figure.autolayout"] = True
# Pandas dataframe
data = pd.DataFrame({"Box1": np.random.rand(10), "Box2": np.random.rand(10)})
# Plot the dataframe
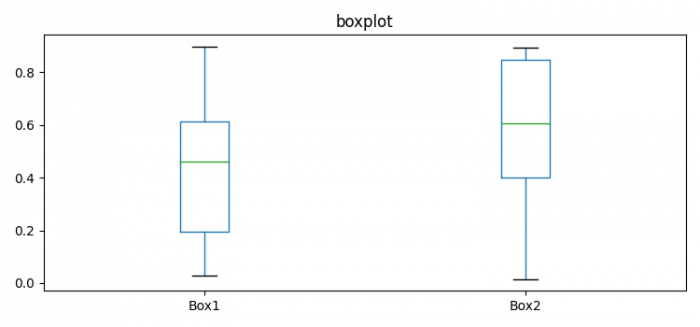
ax = data[['Box1', 'Box2']].plot(kind='box', title='boxplot')
# Display the plot
plt.show()輸出
將產生以下輸出 -

更新於: 13-9-2023
34K+ 檢視次數

廣告