
 資料結構
資料結構 網路
網路 關係資料庫管理系統
 作業系統
作業系統 Java
Java iOS
iOS HTML
HTML CSS
CSS Android
 Python
 C 程式設計
 C++
C++ C#
C# MongoDB
 MySQL
MySQL Javascript
 PHP
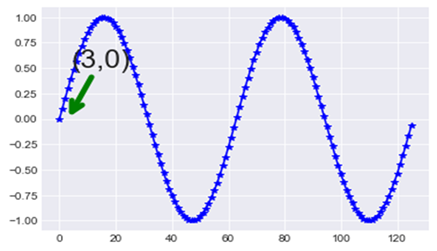
PHP如何在 matplotlib 繪圖中添加註釋?
為了具體說明繪圖的詳細資訊,我們使用了註釋。要建立 Matplotlib 繪圖中的註釋,我們可以使用“註釋”方法。
示例
import matplotlib.pyplot as plt
import numpy as np
#Let us create a plot and use annotation at the point (5,3),
   x = np.arange(0,4*np.pi,0.1)
plt.plot(np.sin(x), 'b-*')
a = plt.annotate("(3,0)", xy=(3, 0), xycoords='data',
   xytext=(4.0,0.5), textcoords='data',
   arrowprops=dict(arrowstyle="->", color="green", lw=5,
   connectionstyle=("arc3,rad=0.")))
plt.setp(a, size=25)
#Display the plot
plt.show()
輸出

更新於: 23-2 月-2021
361 瀏覽

廣告