
 資料結構
資料結構 網路
網路 RDBMS
RDBMS 作業系統
作業系統 Java
Java iOS
iOS HTML
HTML CSS
CSS Android
 Python
 C 程式設計
 C++
C++ C#
C# MongoDB
 MySQL
MySQL Javascript
 PHP
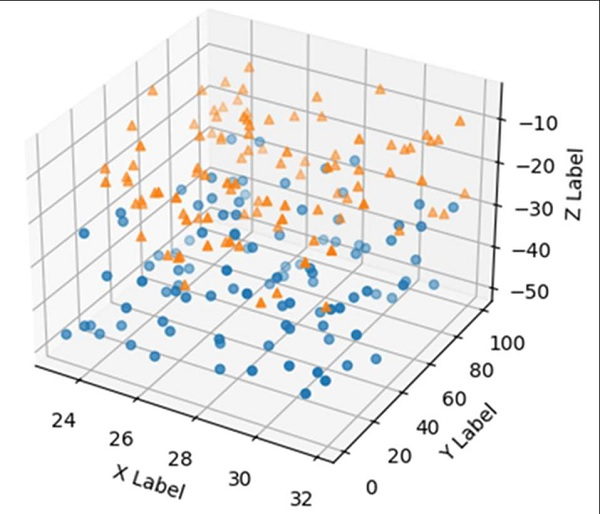
PHP如何用 Python 製作 3D 散點圖?
為了獲得 3D 圖形,我們可以使用 fig.add_subplot(111, projection='3d') 方法例項化軸。然後,我們可以使用 scatter 方法在 x、y 和 z 軸上繪製不同的資料點。
步驟
新建一個圖形或啟用一個現成的圖形。
將一個 `~.axes.Axes` 新增到圖形中,作為子圖形排列的一部分,其中 nrows = 1、ncols = 1、index = 1 且 projection 是“3d”。
遍歷標記、x、y 和 z 的列表,以建立散點。
使用 set_xlabel、y_label 和 z_label 方法設定 x、y 和 z 標籤。
使用 plt.show() 方法繪製圖形。
示例
import matplotlib.pyplot as plt
import numpy as np

np.random.seed(1000)

fig = plt.figure()
ax = fig.add_subplot(111, projection='3d')

n = 100

for m, zl, zh in [('o', -50, -25), ('^', -30, -5)]:
   xs = (32 - 23) * np.random.rand(n) + 23
   ys = (100 - 0) * np.random.rand(n)
   zs = (zh - zl) * np.random.rand(n) + zl
   ax.scatter(xs, ys, zs, marker=m)

ax.set_xlabel('X Label')
ax.set_ylabel('Y Label')
ax.set_zlabel('Z Label')

plt.show()
輸出

更新時間:2021 年 9 月 19 日
2K+ 次瀏覽

廣告