
 資料結構
資料結構 聯網
聯網 RDBMS
RDBMS 作業系統
作業系統 Java
Java iOS
iOS HTML
HTML CSS
CSS Android
 Python
 C 程式設計
 C++
C++ C#
C# MongoDB
 MySQL
MySQL Javascript
 PHP
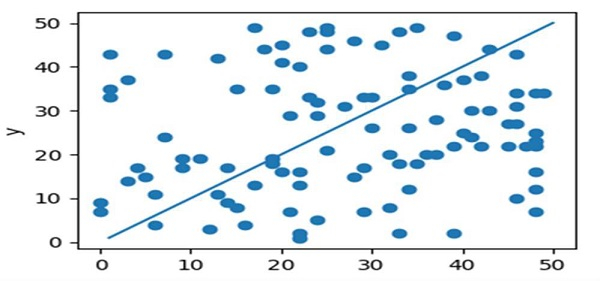
PHP如何在 Python 中繪製散點圖上的線?
首先,我們可以使用 scatter 方法為不同的資料點建立一個散點圖,然後,我們可以使用 plot 方法繪製線條。
步驟
使用 figure() 方法建立一個新圖,或使用 figure size(4, 3) 啟用一個現有圖。
使用 plt.axes() 新增一個軸到當前圖,並使其成為當前軸,建立 x。
使用 scatter() 方法繪製散點。
使用 ax.plot() 方法繪製線條。
使用 plt.xlabel() 方法設定 X 軸標籤。
使用 plt.ylabel() 方法設定 Y 軸標籤。
要顯示圖,請使用 plt.show() 方法。
示例
import random
import matplotlib.pyplot as plt

plt.figure(figsize=(4, 3))
ax = plt.axes()
ax.scatter([random.randint(1, 1000) % 50 for i in range(100)],
[random.randint(1, 1000) % 50 for i in range(100)])
ax.plot([1, 2, 4, 50], [1, 2, 4, 50])

ax.set_xlabel('x')
ax.set_ylabel('y')

plt.show()
輸出

更新時間:17-Mar-2021
13K+ 瀏覽

廣告