
 資料結構
資料結構 網路
網路 RDBMS
RDBMS 作業系統
作業系統 Java
Java iOS
iOS HTML
HTML CSS
CSS Android
 Python
 C 程式設計
 C++
C++ C#
C# MongoDB
 MySQL
MySQL Javascript
 PHP
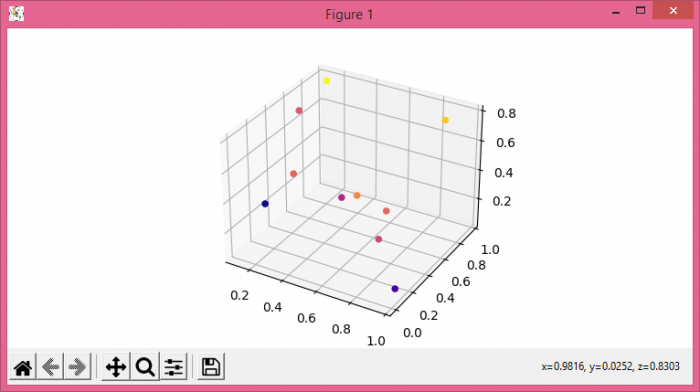
PHP如何在 Matplotlib 的 3D 散點圖中關閉透明度?
若要關閉 Matplotlib 的 3D 散點圖中的透明度,我們可以使用 depthshade 為散點標記著色,以顯示深度效果。
步驟
- 設定圖形大小並調整子圖之間和周圍的填充。
- 建立一個新圖形或啟用一個現有圖形。
- 將 ax 作為子圖排列的一部分新增到圖形中。
- 使用 numpy 建立隨機資料點 x、y 和 z。
- 使用 scatter 方法在具有 depthshade=False 的 3D 軸上繪製 x、y 和 z 資料點。
- 若要顯示圖形,請使用 show() 方法。
示例
import numpy as np
from matplotlib import pyplot as plt

plt.rcParams["figure.figsize"] = [7.50, 3.50]
plt.rcParams["figure.autolayout"] = True

fig = plt.figure()
ax = fig.add_subplot(projection='3d')

N = 10
x = np.random.rand(N)
y = np.random.rand(N)
z = np.random.rand(N)

ax.scatter(x, y, z, c=y, cmap='plasma', alpha=1, depthshade=False)

plt.show()
輸出


更新於: 2021 年 8 月 4 日
1K+ 瀏覽

廣告