- Seaborn 教程
- Seaborn - 首頁
- Seaborn - 簡介
- Seaborn - 環境設定
- 匯入資料集和庫
- Seaborn - 圖形美觀
- Seaborn - 調色盤
- Seaborn - 直方圖
- Seaborn - 核密度估計
- 視覺化成對關係
- Seaborn - 繪製分類資料
- 觀測值的分佈
- Seaborn - 統計估計
- Seaborn - 繪製寬格式資料
- 多面板分類圖
- Seaborn - 線性關係
- Seaborn - Facet Grid
- Seaborn - Pair Grid
- 函式參考
- Seaborn - 函式參考
- Seaborn 有用資源
- Seaborn - 快速指南
- Seaborn - 有用資源
- Seaborn - 討論
Seaborn.set_palette() 方法
Seaborn.set_palette() 方法用於設定繪圖的調色盤。此方法的一個用途是為稍後視覺化的繪圖設定調色盤。使用 seaborn 調色盤,此方法設定 matplotlib 顏色迴圈。
語法
以下是 seaborn.set_palette() 方法的語法:
seaborn.set_palette(palette, n_colors=None, desat=None, color_codes=False)
引數
seaborn.set_palette() 方法的引數如下所述。
| 序號 | 引數和描述 |
|---|---|
| 1 | 調色盤 (Palette) 要設定的調色盤。 |
| 2 | 顏色數量 (n_colors) 迴圈中的顏色數量。 |
| 3 | 去飽和度 (Desat) 每個顏色去飽和的比例。 |
| 4 | 顏色程式碼 (Color_codes) 接受布林值,如果傳遞 True,則將簡寫顏色程式碼(例如“b”、“g”、“r”等)重新對映到此調色盤中的顏色。 |
載入 seaborn 庫
在繼續開發繪圖之前,讓我們載入 seaborn 庫和資料集。要載入或匯入 seaborn 庫,可以使用以下程式碼行。
Import seaborn as sns
載入資料集
在本文中,我們將使用 seaborn 庫中內建的泰坦尼克號資料集。以下命令用於載入資料集。
titanic=sns.load_dataset("titanic")
以下命令用於檢視資料集中前 5 行。這使我們能夠了解可以使用哪些變數來繪製圖形。
titanic.head()
以下是上述程式碼段的輸出。
index,survived,pclass,sex,age,sibsp,parch,fare,embarked,class,who,adult_male,deck,embark_town,alive,alone
0,0,3,male,22.0,1,0,7.25,S,Third,man,true,NaN,Southampton,no,false
1,1,1,female,38.0,1,0,71.2833,C,First,woman,false,C,Cherbourg,yes,false
2,1,3,female,26.0,0,0,7.925,S,Third,woman,false,NaN,Southampton,yes,true
現在我們已經載入了資料集,我們將探索一些示例。
如上所述,set_palette 方法用於設定以下繪圖的顏色調色盤,它接受不同的值,其中一些值為:
{'Accent', 'Accent_r', 'Blues', 'Blues_r', 'BrBG', 'BrBG_r', 'BuGn', 'BuGn_r', 'BuPu', 'BuPu_r', 'CMRmap', 'CMRmap_r', 'Dark2', 'Dark2_r', 'GnBu', 'GnBu_r', 'Greens', 'Greens_r', 'Greys', 'Greys_r', 'OrRd', 'OrRd_r', 'Oranges', 'Oranges_r', 'PRGn', 'PRGn_r', 'Paired', 'Paired_r', 'Pastel1', 'Pastel1_r', 'Pastel2', 'Pastel2_r', 'PiYG'}
以下示例描述了 seaborn.set_palette() 方法的用法。
示例 1
在下面的示例中,我們將 icefire 作為顏色調色盤傳遞給 set_palette() 方法並繪製圖形以檢視顏色調色盤。
import seaborn as sns
import matplotlib.pyplot as plt
titanic=sns.load_dataset("titanic")
titanic.head()
sns.set_palette("icefire")
plt.show()
接下來,我們將繪製一個圖形來檢視設定的顏色調色盤。在此示例中,我們將使用 stripplot() 方法並使用 seaborn 庫中內建的泰坦尼克號資料集。
import seaborn as sns
import matplotlib.pyplot as plt
titanic=sns.load_dataset("titanic")
titanic.head()
sns.stripplot(x="age", y="who", hue="alive",data=titanic,jitter=0.5,linewidth=1)
plt.show()
輸出
示例 2
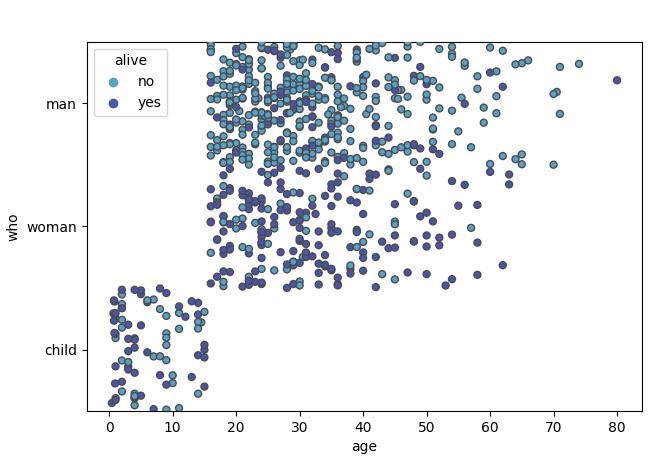
在此示例中,我們將瞭解 set 中另一個顏色調色盤的工作原理。
import seaborn as sns
import matplotlib.pyplot as plt
titanic=sns.load_dataset("titanic")
titanic.head()
sns.set_palette("pastel")
sns.stripplot(x="age", y="who", hue="alive",data=titanic,jitter=0.5,linewidth=1)
plt.show()
上述程式碼包含以下顏色調色盤,用於傳遞的調色盤名稱。

輸出
上述示例的輸出如下:

示例 3
在此示例中,我們將透過簡單地將其作為引數傳遞給 set_palette() 方法來檢視另一個 matplotlib 調色盤。
import seaborn as sns
import matplotlib.pyplot as plt
titanic=sns.load_dataset("titanic")
titanic.head()
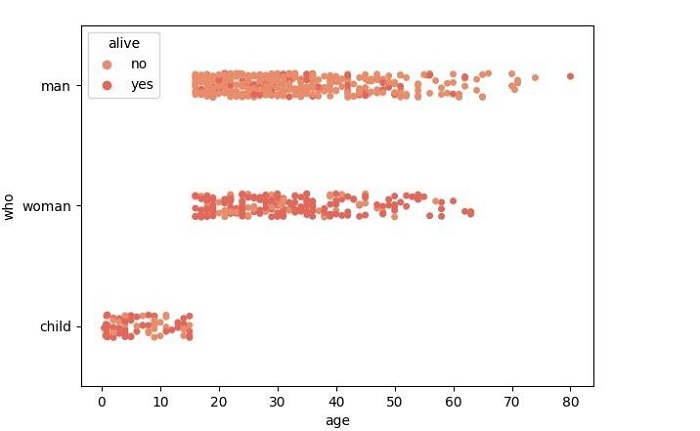
sns.set_palette("flare")
plt.show()
上述程式碼行將包含以下顏色序列,這些顏色是調色盤的一部分,稍後生成的繪圖將包含類似的顏色。

假設使用以下程式碼生成繪圖,則將獲得如下所示的繪圖,並且如觀察到的那樣,它包含與上述 pantone 中顯示的顏色相同的顏色。
import seaborn as sns
import matplotlib.pyplot as plt
titanic=sns.load_dataset("titanic")
titanic.head()
sns.stripplot(x="age", y="who", hue="alive",data=titanic)
plt.show()
輸出
生成的輸出圖如下所示: