- Seaborn 教程
- Seaborn - 首頁
- Seaborn - 簡介
- Seaborn - 環境設定
- 匯入資料集和庫
- Seaborn - 圖形美觀
- Seaborn - 調色盤
- Seaborn - 直方圖
- Seaborn - 核密度估計
- 視覺化成對關係
- Seaborn - 繪製分類資料
- 觀測值的分佈
- Seaborn - 統計估計
- Seaborn - 繪製寬格式資料
- 多面板分類圖
- Seaborn - 線性關係
- Seaborn - Facet Grid
- Seaborn - Pair Grid
- 函式參考
- Seaborn - 函式參考
- Seaborn 有用資源
- Seaborn - 快速指南
- Seaborn - 有用資源
- Seaborn - 討論
Seaborn.set_hls_values() 方法
Seaborn.set_hls_values() 方法用於飽和顏色,然後返回此飽和顏色。換句話說,該方法獨立地操作顏色的 h、l 和 s 通道。
顏色的 h、l 和 s 通道分別表示影像的色調、亮度和飽和度分量。色調描述影像的顏色,飽和度是此顏色的純度,亮度是色調的密度。
語法
以下是 seaborn.set_hls_values() 方法的語法:
seaborn.set_hls_values(color,h=None,l=None,s=None)
引數
下面給出了此 seaborn.set_hls_values() 方法的引數。
| 序號 | 引數及描述 |
|---|---|
| 1 | color 此引數以 matplotlib 顏色作為輸入,值包括十六進位制、rgb 元組或 html 顏色名稱。 |
| 2 | h,l,s 表格浮點值介於 0 和 1 之間或無值,並分別確定每個通道的值。 |
返回值
此方法的返回值是一個 rgb 元組,其中包含傳遞的顏色飽和顏色。
示例 1
現在我們將看到該方法如何透過向其傳遞顏色以及介於 1 和 0 之間的色調和飽和度值來工作。
sns.set_hls_values("green",h=0.5,s=0.5)
輸出
生成的輸出如下所示。將值設定為給定值後,顏色的 rgb 元組作為輸出給出。
(0.12549019607843137, 0.37647058823529406, 0.3764705882352941)
示例 2
示例 2 在此示例中,我們將飽和另一種顏色並獲得修改後的顏色。我們可以使用 palplot 方法來視覺化由set_hls_values()方法傳送的 rgb 元組。
可以使用以下程式碼行執行此操作。
import seaborn as sns
import matplotlib.pyplot as plt
titanic=sns.load_dataset("titanic")
titanic.head()
# 1st example
#sns.set_hls_values("green",h=0.5,s=0.5)
# 2nd example
#sns.palplot(sns.set_hls_values("green",h=0.5,s=0.5,l=0.8))
# 3rd example
#sns.palplot(sns.set_hls_values("yellow",h=0.44,l=0.2,s=0.1))
plt.show()
輸出
輸出如下:
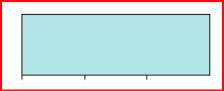
示例 3
我們將使用 palplot 方法來視覺化修改其色調、飽和度和亮度後的顏色。在這種情況下,顏色為紫色。以下程式碼行用於執行此操作。
import seaborn as sns
import matplotlib.pyplot as plt
titanic=sns.load_dataset("titanic")
titanic.head()
sns.palplot(sns.set_hls_values("yellow",h=0.44,l=0.2,s=0.1))
plt.show()
輸出
輸出如下:

seaborn_utility_functions_introduction.htm
廣告