- Seaborn 教程
- Seaborn - 首頁
- Seaborn - 簡介
- Seaborn - 環境設定
- 匯入資料集和庫
- Seaborn - 圖形美觀
- Seaborn - 調色盤
- Seaborn - 直方圖
- Seaborn - 核密度估計
- 視覺化成對關係
- Seaborn - 繪製分類資料
- 觀測值的分佈
- Seaborn - 統計估計
- Seaborn - 繪製寬格式資料
- 多面板分類圖
- Seaborn - 線性關係
- Seaborn - Facet Grid
- Seaborn - Pair Grid
- 函式參考
- Seaborn - 函式參考
- Seaborn 有用資源
- Seaborn - 快速指南
- Seaborn - 有用資源
- Seaborn - 討論
Seaborn.rugplot() 方法
Seaborn.rugplot() 方法用於繪製邊緣分佈,並允許沿著 x 軸和 y 軸繪製刻度。透過清晰地顯示單個觀測值的位置,此函式旨在補充現有的顯示。
因此,rugplot() 方法實質上是在已經存在的圖上新增地毯或刻度。
但是什麼是地毯圖?地毯圖是一種圖表,它繪製單個定量值的資料,並將其顯示為沿著軸的標記。這些圖通常用於二維散點圖,方法是在 x 軸上標記 x 值的地毯圖,在 y 軸上標記 y 值的地毯圖。
語法
以下是Seaborn.rugplot() 方法的語法:
seaborn.rugplot(x=None, *, height=0.025, axis=None, ax=None, data=None, y=None, hue=None, palette=None, hue_order=None, hue_norm=None, expand_margins=True, legend=True, a=None, **kwargs
引數
下面討論了此方法的一些引數。
| 序號 | 引數及描述 |
|---|---|
| 1 | x,y 表示在 x,y 軸上的變數。 |
| 2 | 資料 用於傳遞用於繪圖的資料集。 |
| 3 | 高度 此引數取一個值,該值確定每個地毯元素覆蓋的軸範圍的比例。 |
| 4 | 調色盤 當考慮色相對映時,此引數設定圖表的顏色。 |
| 5 | Hue_order 在色相語義中繪製分類變數的順序。 |
| 6 | Hue_norm 用於設定色相語義中資料單位的歸一化範圍。提供一對資料值。 |
| 7 | Ax 預期透過此引數傳遞用於繪圖的預先存在的軸。 |
| 8 | Expand_margins 取布林值,如果傳遞 True,則應根據地毯的高度增加軸的邊距,以防止元素重疊。 |
| 9 | 圖例 布林值。如果為 false,則不列印語義變數的圖例。 |
返回值
此方法返回包含繪圖點的 matplotlib 軸。
載入 seaborn 庫
在繼續開發繪圖之前,讓我們載入 seaborn 庫和資料集。要載入或匯入 seaborn 庫,可以使用以下程式碼行。
Import seaborn as sns
載入資料集
在本文中,我們將使用 seaborn 庫中內建的 Tips 資料集。以下命令用於載入資料集。
tips=sns.load_dataset("tips")
以下提到的命令用於檢視資料集中前 5 行。這使我們能夠了解可以使用哪些變數來繪製圖表。
tips.head()
以下是上述程式碼段的輸出。
index,total_bill,tip,sex,smoker,day,time,size
0,16.99,1.01,Female,No,Sun,Dinner,2
1,10.34,1.66,Male,No,Sun,Dinner,3
2,21.01,3.5,Male,No,Sun,Dinner,3
3,23.68,3.31,Male,No,Sun,Dinner,2
4,24.59,3.61,Female,No,Sun,Dinner,4
現在我們已經載入了資料,我們將繼續繪製資料。
示例 1
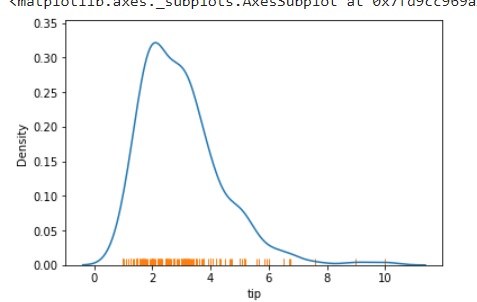
在此示例中,我們將瞭解如何在圖中沿一個軸新增地毯。為此,對於 x 軸,下面提到了程式碼。
import seaborn as sns
import matplotlib.pyplot as plt
tips=sns.load_dataset("tips")
tips.head()
sns.kdeplot(data=tips, x="tip")
sns.rugplot(data=tips, x="tip")
plt.show()
輸出
該圖將類似於下圖所示。
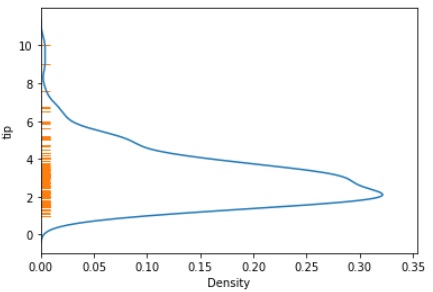
要在 y 軸上繪製地毯,可以使用以下程式碼。
import seaborn as sns
import matplotlib.pyplot as plt
tips=sns.load_dataset("tips")
tips.head()
sns.kdeplot(data=tips, y="tip")
sns.rugplot(data=tips, y="tip")
plt.show()
該圖將類似於下圖所示。
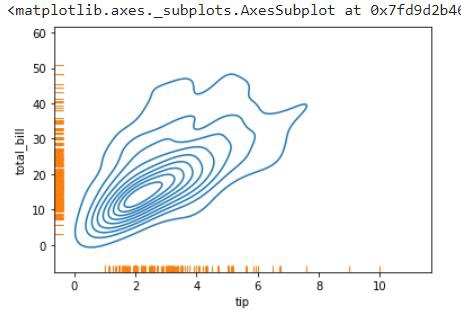
示例 2
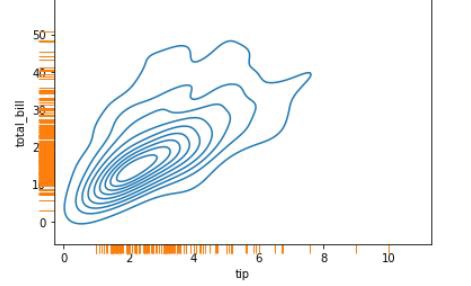
在此示例中,我們將瞭解如何在給定圖中的兩個軸上繪製地毯。
import seaborn as sns
import matplotlib.pyplot as plt
tips=sns.load_dataset("tips")
tips.head()
sns.kdeplot(data=tips, x="tip",y="total_bill")
sns.rugplot(data=tips, x="tip",y="total_bill")
plt.show()
輸出
該圖將類似於下面提到的圖。
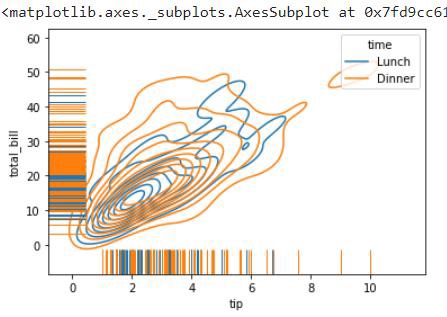
示例 3
在需要沿著圖的軸繪製更高地毯並表示色相對映的情況下,可以使用以下程式碼。在這裡,height 引數可用於指定地毯的高度,hue 引數用於指定色相對映。
import seaborn as sns
import matplotlib.pyplot as plt
tips=sns.load_dataset("tips")
tips.head()
sns.kdeplot(data=tips, x="tip",y="total_bill",hue="time")
sns.rugplot(data=tips, x="tip",y="total_bill",hue="time",height=.1)
plt.show()
輸出
此場景的圖表可以在下面看到。
示例 4
為了確保地毯在軸之外而不是在圖內。可以使用 clip_on 引數。它採用布林值,如果為 False,則將地毯置於軸之外。
import seaborn as sns
import matplotlib.pyplot as plt
tips=sns.load_dataset("tips")
tips.head()
sns.kdeplot(data=tips, x="tip",y="total_bill")
sns.rugplot(data=tips, x="tip",y="total_bill",height=-0.04,clip_on=False)
plt.show()
輸出
此程式碼的輸出如下
這樣,就可以使用 rugplot() 方法及其引數。