- Seaborn 教程
- Seaborn - 首頁
- Seaborn - 簡介
- Seaborn - 環境設定
- 匯入資料集和庫
- Seaborn - 圖表美學
- Seaborn - 調色盤
- Seaborn - 直方圖
- Seaborn - 核密度估計
- 視覺化成對關係
- Seaborn - 繪製分類資料
- 觀測值的分佈
- Seaborn - 統計估計
- Seaborn - 繪製寬格式資料
- 多面板分類圖
- Seaborn - 線性關係
- Seaborn - FacetGrid
- Seaborn - PairGrid
- 函式參考
- Seaborn - 函式參考
- Seaborn 有用資源
- Seaborn - 快速指南
- Seaborn - 有用資源
- Seaborn - 討論
Seaborn.move_legend() 方法
圖表或繪圖中的圖例是頁面的一部分,或者圖表的一部分,它有助於解釋/理解圖表。Seaborn.move_legend() 方法用於將圖表的圖例重新建立到新的位置。
您無法訪問 Matplotlib 圖例的位置引數,因此,儘管名稱表明此方法移動圖例,但它實際上是複製圖例的資訊,在新的位置重新建立它並刪除舊的圖例。
語法
以下是 seaborn.move_legend() 方法的語法:
seaborn.move_legend(obj, loc, **kwargs)
引數
下面描述了 move_legend() 方法的引數。
| 序號 | 名稱和描述 |
|---|---|
| 1 | Obj 這是與繪圖關聯的物件。 |
| 2 | Loc 此引數接受字串或整數,它是位置引數。 |
| 3 | Kwargs 可以傳遞其他引數。 |
loc 引數接受諸如“右中”、“左中”、“右上”、“左上”、“左下”、“右下”、“右”、“下中”、“上中”和“中”等值。可以傳遞的其他 kwargs 是 matplotlib 圖例方法的一部分。
要了解如何使用它,我們需要繪製圖表,為此,我們必須從庫中匯入內建資料集。
在繼續繪製圖表之前,讓我們載入 seaborn 庫和資料集。
載入 seaborn 庫
要載入或匯入 seaborn 庫,可以使用以下程式碼行。
Import seaborn as sns
載入資料集
在本文中,我們將使用 seaborn 庫中內建的泰坦尼克號資料集。使用以下命令載入資料集。
titanic=sns.load_dataset("titanic")
以下命令用於檢視資料集中前 5 行。這使我們能夠了解可以使用哪些變數來繪製圖表。
titanic.head()
以下是上述程式碼的輸出。
index,survived,pclass,sex,age,sibsp,parch,fare,embarked,class,who,adult_male,deck,embark_town,alive,alone
0,0,3,male,22.0,1,0,7.25,S,Third,man,true,NaN,Southampton,no,false
1,1,1,female,38.0,1,0,71.2833,C,First,woman,false,C,Cherbourg,yes,false
2,1,3,female,26.0,0,0,7.925,S,Third,woman,false,NaN,Southampton,yes,true
現在我們已經載入了資料集,我們將探索一些示例。
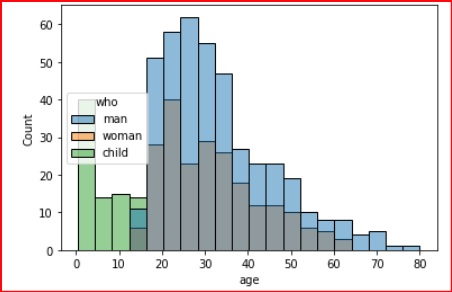
示例 1
在這個例子中,我們將瞭解如何使用 move_legend() 方法來更改圖例的位置。在這個例子中,我們將一個位置傳遞給 loc 引數,然後觀察圖例在顯示的圖表中如何變化。
import seaborn as sns
import matplotlib.pyplot as plt
titanic=sns.load_dataset("titanic")
titanic.head()
ax = sns.histplot(titanic, x="age", hue="who")
sns.move_legend(ax, "center left")
plt.show()
輸出
產生的輸出如下:
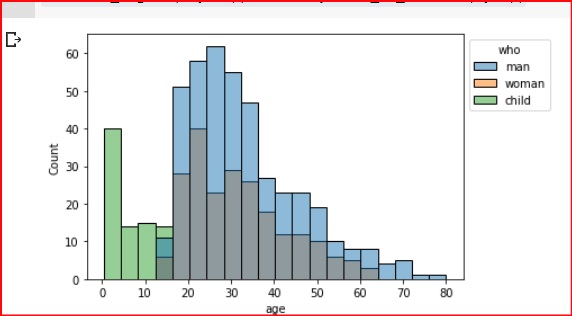
示例 2
在這個例子中,我們將圖例移到圖表的左上角。由於 bbox_to_anchor 設定為 (1,1),圖例被移到了繪圖邊界之外。此引數用於精細控制,例如將圖例移出框外。
import seaborn as sns
import matplotlib.pyplot as plt
titanic=sns.load_dataset("titanic")
titanic.head()
ax = sns.histplot(titanic, x="age", hue="who")
sns.move_legend(ax, "upper left", bbox_to_anchor=(1, 1))
plt.show()
輸出
產生的輸出如下:
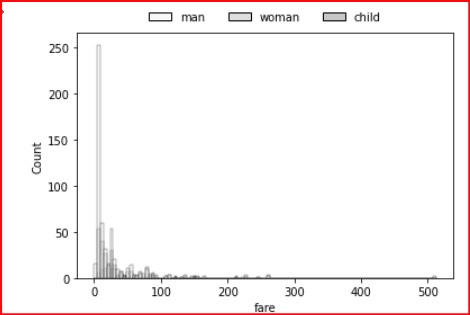
示例 3
在這個例子中,我們將向圖例新增一些屬性以更改其外觀。可以使用以下程式碼行來獲得下圖所示的圖例。
import seaborn as sns
import matplotlib.pyplot as plt
titanic=sns.load_dataset("titanic")
titanic.head()
ax = sns.histplot(titanic, x="age", hue="who")
sns.move_legend(ax, "lower center", bbox_to_anchor=(.5, 1), ncol=3, title=None, frameon=False)
plt.show()
輸出
上述程式碼的輸出,其中圖例的屬性略微更改以使其看起來更具風格,如下所示。