- Seaborn 教程
- Seaborn - 首頁
- Seaborn - 簡介
- Seaborn - 環境搭建
- 匯入資料集和庫
- Seaborn - 圖形美觀
- Seaborn - 調色盤
- Seaborn - 直方圖
- Seaborn - 核密度估計
- 視覺化成對關係
- Seaborn - 繪製分類資料
- 觀測值的分佈
- Seaborn - 統計估計
- Seaborn - 繪製寬格式資料
- 多面板分類圖
- Seaborn - 線性關係
- Seaborn - Facet Grid
- Seaborn - Pair Grid
- 函式參考
- Seaborn - 函式參考
- Seaborn 有用資源
- Seaborn - 快速指南
- Seaborn - 有用資源
- Seaborn - 討論
Seaborn.husl_palette() 方法
Seaborn.husl_palette() 方法用於獲取一組均勻分佈的顏色,這些顏色是 HUSL 色彩空間的一部分。
HUSL 色彩空間根據色調、飽和度和亮度定義顏色。這些色調沿著圓形路徑均勻分佈,從而產生適合分類或迴圈資料的調色盤。
此函式使用非線性色彩空間,該色彩空間在感知上更均勻,但在其他方面類似於 hls_palette() 方法。HSL 的值始終應在 0 到 1 之間。
語法
以下是 husl_palette() 方法的語法:
seaborn.husl_palette(n_colors=6, h=0.01, s=0.9, l=0.65, as_cmap=False)
引數
下面描述了 husl 調色盤方法的引數。
| 序號 | 引數及描述 |
|---|---|
| 1 | n_colors 迴圈中的顏色數。 |
| 2 | h 接受浮點數,是顏色迴圈的第一個色調。 |
| 3 | s 接受浮點值,是顏色的飽和度。 |
| 4 | l 接受浮點值,是顏色的亮度。 |
返回值
它返回一個 matplotlib 顏色對映的 RGB 元組列表。
示例 1
在此示例中,我們將瞭解 husl_palette() 方法的工作原理。此方法基本上允許使用者透過更改顏色的色調、亮度和飽和度來建立自定義調色盤。為了繪製建立的自定義調色盤,使用了 palplot() 方法。
此 seaborn.palplot() 方法使使用者能夠繪製自定義調色盤並檢視特定調色盤中包含的色調。color_palette 和 palplto() 方法之間的區別在於,color_palette() 方法繪製 matplotlib 調色盤的顏色,而 palplot() 方法用於繪製自定義調色盤。
import seaborn as sns
import matplotlib.pyplot as plt
titanic=sns.load_dataset("titanic")
titanic.head()
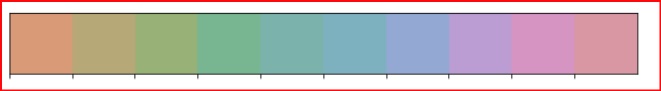
sns.palplot(sns.husl_palette(15))
plt.show()
輸出
獲得的輸出如下:

示例 2
在此示例中,我們將色調值以及 n_colors 值傳遞給 husl_paletee() 方法。這裡,色調值設定為 0.4,它是自定義顏色系列中第一個色調的值。
import seaborn as sns
import matplotlib.pyplot as plt
titanic=sns.load_dataset("titanic")
titanic.head()
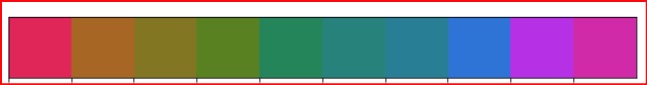
sns.palplot(sns.husl_palette(15,h=0.4))
plt.show()
輸出
獲得的輸出是以下顏色系列:

示例 3
這裡,我們將飽和度值以及 n-colors 值傳遞給方法。在此示例中,飽和度設定為 0.2。
import seaborn as sns
import matplotlib.pyplot as plt
titanic=sns.load_dataset("titanic")
titanic.head()
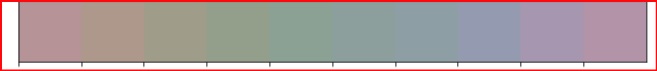
sns.palplot(sns.husl_palette(10, s=.2))
plt.show()
輸出
產生的輸出如下:
示例 4
這裡,我們將亮度值以及 n_colors 值傳遞給方法。在此示例中,亮度設定為 0.5。
import seaborn as sns
import matplotlib.pyplot as plt
titanic=sns.load_dataset("titanic")
titanic.head()
sns.palplot(sns.husl_palette(10, l=.5))
plt.show()
輸出
產生的輸出如下:
示例 5
這裡,我們將所有引數傳遞給 husl_palette() 方法,然後繪製顏色。
import seaborn as snsn
import matplotlib.pyplot as plt
titanic=sns.load_dataset("titanic")
titanic.head()
sns.palplot(sns.husl_palette(10, l=.7,s=.5,h=0.1))
plt.show()
輸出
產生的輸出如下: