- Scikit Image 教程
- Scikit Image - 簡介
- Scikit Image - 影像處理
- Scikit Image - Numpy 影像
- Scikit Image - 影像資料型別
- Scikit Image - 使用外掛
- Scikit Image - 影像處理
- Scikit Image - 讀取影像
- Scikit Image - 寫入影像
- Scikit Image - 顯示影像
- Scikit Image - 影像集合
- Scikit Image - 影像堆疊
- Scikit Image - 多張影像
Scikit Image - 使用 Plotly
Python 中的Plotly通常被稱為“plotly.py”。它是一個免費的開源繪相簿,構建在“plotly.js”之上。Plotly.py 提供了一套豐富的功能,並支援超過 40 種獨特的圖表型別。它廣泛用於金融分析、地理製圖、科學視覺化、3D 繪圖和資料分析應用程式。
它提供了一個互動式介面,允許使用者探索和互動資料視覺化。它提供了縮放、平移、工具提示和懸停效果等功能,使分析和理解複雜資料集變得容易。
Scikit Image 使用 Plotly
Plotly.py可以與 scikit-image 庫一起使用,以實現與影像處理相關的各種資料視覺化任務。要設定 plotly,您需要確保庫已安裝並已正確配置。
使用 pip 安裝 plotly
在命令提示符中執行以下命令以安裝 plotly 模組。這是一種從 PyPi 安裝最新 Plotly 包的簡單方法。
pip install plotly
使用 conda 安裝 plotly
如果您已經在系統中使用 Anaconda 發行版,則可以直接使用 conda 包管理器來安裝 plotly。
conda install -c plotly plotly
安裝 Plotly 後,您可以使用以下語句將其匯入到 Python 指令碼或互動式會話中:
import plotly
這將匯入 Plotly 中必要的模組,以建立互動式和可自定義的視覺化效果。以下是一些基本的 Python 程式,演示瞭如何將 Plotly 與 scikit-image 一起使用,以有效地執行影像處理任務中的資料視覺化。
示例 1
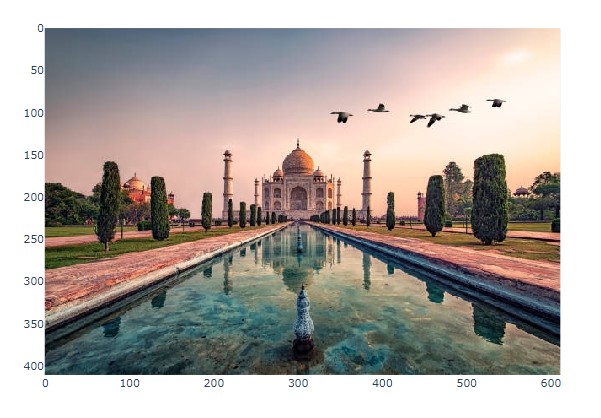
以下示例使用Plotly.express.imshow()方法顯示 RBG 影像。
import plotly.express as px
from skimage import io

# Read an image
image = io.imread('Images/Tajmahal.jpg')
# Display the image using Plotly
fig = px.imshow(image)
fig.show()
輸出
執行上述程式後,您將獲得以下輸出:
示例 2
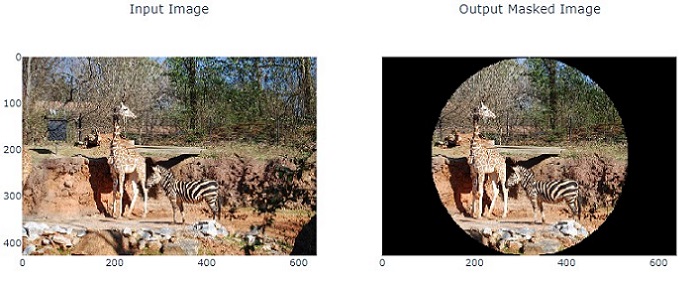
以下示例演示瞭如何使用 scikit-image 對影像應用圓形遮罩,並使用 Plotly 並排顯示原始影像和遮罩影像。
import matplotlib.pyplot as plt
from skimage import io
import numpy as np

# Load the image
image_path = 'Images_/Zoo.jpg'
image = io.imread(image_path)
image_copy = np.copy(image)

# Create circular mask
rows, cols, _ = image.shape
row, col = np.ogrid[:rows, :cols]
center_row, center_col = rows / 2, cols / 2
radius = min(rows, cols) / 2
outer_disk_mask = ((row - center_row)**2 + (col - center_col)**2 > radius**2)

# Apply mask to image
image[outer_disk_mask] = 0

# Display the original and masked images using Matplotlib
fig, axes = plt.subplots(nrows=1, ncols=2, figsize=(10, 5))
axes[0].imshow(image_copy)
axes[0].set_title('Original Image')
axes[0].axis('off')
axes[1].imshow(image)
axes[1].set_title('Masked Image')
axes[1].axis('off')
plt.tight_layout()
plt.show()
輸出
廣告