- Scikit Image 教程
- Scikit Image - 簡介
- Scikit Image - 影像處理
- Scikit Image - Numpy影像
- Scikit Image - 影像資料型別
- Scikit Image - 使用外掛
- Scikit Image - 影像處理
- Scikit Image - 讀取影像
- Scikit Image - 寫入影像
- Scikit Image - 顯示影像
- Scikit Image - 影像集合
- Scikit Image - 影像堆疊
- Scikit Image - 多影像
- Scikit Image - 資料視覺化
- Scikit Image - 使用Matplotlib
- Scikit Image - 使用Plotly
- Scikit Image - 使用Mayavi
- Scikit Image - 使用Napari
Scikit Image - 使用Matplotlib
Matplotlib 是Python中廣泛使用的繪相簿,它提供各種功能來建立不同型別的圖表和視覺化效果。它是一個強大的庫,能夠在Python程式語言中建立靜態、動畫和互動式視覺化效果。
Scikit Image與Matplotlib
在影像處理的背景下視覺化影像時,可以將Matplotlib與scikit-image庫結合使用以實現各種視覺化任務。通常,Scikit-image庫提供諸如io.imshow()和io.show()之類的函式來顯示影像,但是,我們可以使用Matplotlib的imshow()函式來顯示影像,並提供其他選項,例如註釋、顏色圖、座標軸配置等等。
此外,它對於在一個圖形中建立多個繪圖(也就是子圖)非常有用,可以用來比較影像的不同版本或顯示影像處理工作流程中的中間步驟。
要設定Matplotlib以便與scikit-image一起使用,你需要確保這兩個庫都已安裝並正確配置。建議使用pip或conda之類的包管理器來安裝Matplotlib。pip是Python的預設包管理器,而Conda是用於管理Anaconda環境中包的流行選擇。
使用pip安裝Matplotlib
要使用pip安裝Matplotlib,只需在你的命令提示符中執行以下命令:
pip install Matplotlib
這將下載Matplotlib包。
使用Conda安裝Matplotlib
如果你的系統中已經使用了Anaconda發行版,那麼你可以直接使用conda包管理器來安裝Matplotlib。以下為命令:
conda install matplotlib
安裝成功後,你就可以直接匯入matplotlib.pyplot和skimage庫來訪問所需的函式,在你的Python指令碼或筆記本中執行影像處理任務。
下面是一些基本的Python程式,它們演示瞭如何有效地使用Matplotlib庫以及scikit-image執行資料視覺化任務。
示例1
以下示例演示瞭如何使用Matplotlib顯示scikit-image載入的影像。
from skimage import io
import matplotlib.pyplot as plt

# Read an image
image_data = io.imread('Images/logo-w.png')
# Display the image using Matplotlib
plt.imshow(image_data)
plt.title('Logo', fontsize=18)
輸出
執行上述程式後,你將獲得以下輸出:
示例2
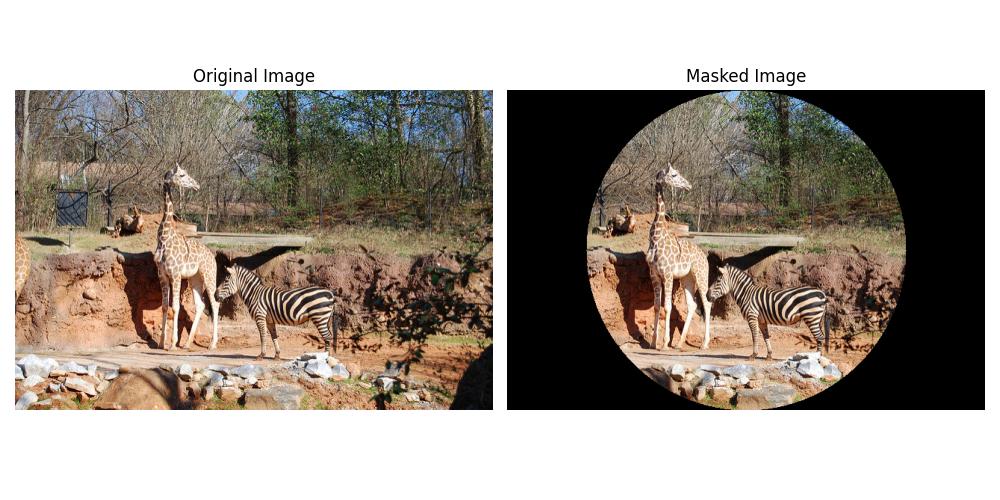
以下示例演示瞭如何使用scikit-image將圓形遮罩應用於影像,並使用Matplotlib並排顯示原始影像和遮罩影像。
import matplotlib.pyplot as plt
from skimage import io
import numpy as np

# Load the image
image_path = 'Images_/Zoo.jpg'
image = io.imread(image_path)
image_copy = np.copy(image)

# Create circular mask
rows, cols, _ = image.shape
row, col = np.ogrid[:rows, :cols]
center_row, center_col = rows / 2, cols / 2
radius = min(rows, cols) / 2
outer_disk_mask = ((row - center_row)**2 + (col - center_col)**2 > radius**2)

# Apply mask to image
image[outer_disk_mask] = 0

# Display the original and masked images using Matplotlib
fig, axes = plt.subplots(nrows=1, ncols=2, figsize=(10, 5))
axes[0].imshow(image_copy)
axes[0].set_title('Original Image')
axes[0].axis('off')
axes[1].imshow(image)
axes[1].set_title('Masked Image')
axes[1].axis('off')
plt.tight_layout()
plt.show()
輸出
執行上述程式後,你將獲得以下輸出: