- Elasticsearch 教程
- Elasticsearch - 首頁
- Elasticsearch - 基本概念
- Elasticsearch - 安裝
- Elasticsearch - 資料填充
- 版本遷移
- Elasticsearch - API 約定
- Elasticsearch - 文件 API
- Elasticsearch - 搜尋 API
- Elasticsearch - 聚合
- Elasticsearch - 索引 API
- Elasticsearch - CAT API
- Elasticsearch - 叢集 API
- Elasticsearch - 查詢 DSL
- Elasticsearch - 對映
- Elasticsearch - 分析
- Elasticsearch - 模組
- Elasticsearch - 索引模組
- Elasticsearch - Ingest 節點
- Elasticsearch - 管理索引生命週期
- Elasticsearch - SQL 訪問
- Elasticsearch - 監控
- Elasticsearch - 資料彙總
- Elasticsearch - 凍結索引
- Elasticsearch - 測試
- Elasticsearch - Kibana 儀表盤
- Elasticsearch - 按欄位篩選
- Elasticsearch - 資料表
- Elasticsearch - 地區地圖
- Elasticsearch - 餅圖
- Elasticsearch - 面積圖和條形圖
- Elasticsearch - 時間序列
- Elasticsearch - 詞雲
- Elasticsearch - 熱力圖
- Elasticsearch - Canvas
- Elasticsearch - 日誌 UI
- Elasticsearch 有用資源
- Elasticsearch - 快速指南
- Elasticsearch - 有用資源
- Elasticsearch - 討論
Elasticsearch - 地區地圖
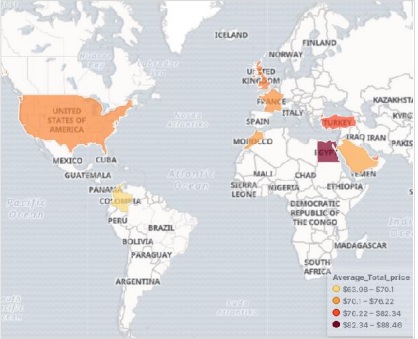
地區地圖在地理地圖上顯示指標。它有助於檢視與不同地理區域相關聯的資料,並顯示不同的強度。較深的陰影通常表示較高的值,較淺的陰影表示較低的值。
建立此視覺化的步驟如下所述:
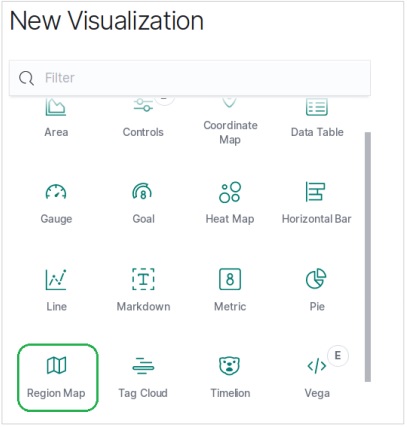
視覺化
在此步驟中,我們轉到 Kibana 首頁左側欄中可用的“視覺化”按鈕,然後選擇新增新視覺化的選項。
以下螢幕顯示了我們如何選擇地區地圖選項。
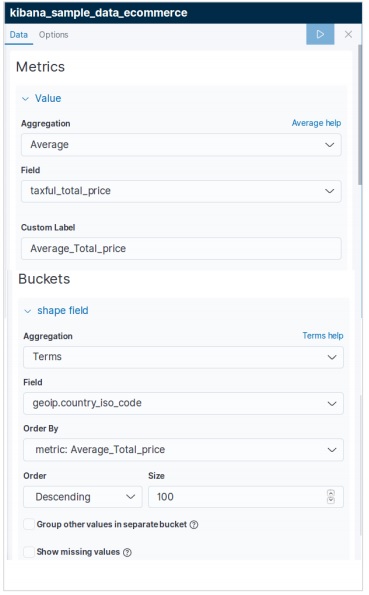
選擇指標
下一個螢幕提示我們選擇用於建立地區地圖的指標。在這裡,我們選擇平均價格作為指標,並將 country_iso_code 作為用於建立視覺化的桶中的欄位。
下面的最終結果顯示了應用選擇後的地區地圖。請注意顏色的陰影及其在標籤中提到的值。
廣告