
 資料結構
資料結構 網路
網路 RDBMS
RDBMS 作業系統
作業系統 Java
Java iOS
iOS HTML
HTML CSS
CSS Android
 Python
 C 程式設計
 C++
C++ C#
C# MongoDB
 MySQL
MySQL Javascript
 PHP
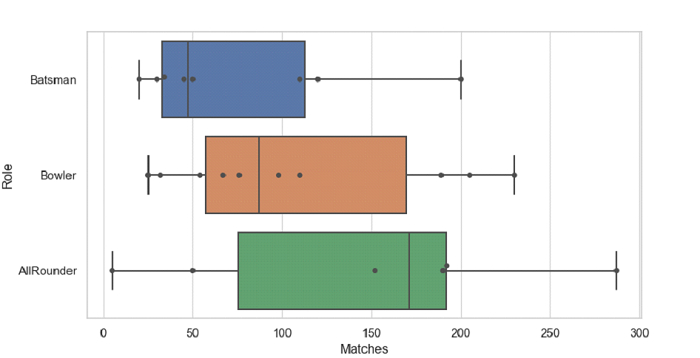
PHPPython Pandas - 使用 Seaborn 在箱線圖上繪製觀察群
Seaborn 中的群圖用於繪製具有非重疊點的分類散點圖。seaborn.swarmplot() 用於此。使用 seaborn.boxplot() 在箱線圖上繪製觀察群。
假設以下內容是我們的 CSV 檔案形式的資料集 −Cricketers2.csv
首先,匯入所需的庫 −
import seaborn as sb
import pandas as pd
import numpy as np
import matplotlib.pyplot as plt
從 CSV 檔案中載入資料到 Pandas 資料框 −
dataFrame = pd.read_csv("C:\Users\amit_\Desktop\Cricketers2.csv")
在箱線圖上繪製觀察群 −
sb.boxplot(x = "Matches", y = "Role", data= dataFrame, whis=np.inf)
sb.swarmplot(x = "Matches", y = "Role", data= dataFrame, color=".3")
示例
以下是程式碼
import seaborn as sb
import pandas as pd
import numpy as np
import matplotlib.pyplot as plt

# Load data from a CSV file into a Pandas DataFrame
dataFrame = pd.read_csv("C:\Users\amit_\Desktop\Cricketers2.csv")

sb.set_theme(style="whitegrid")

# draw swarms of observations on top of a box plot
sb.boxplot(x = "Matches", y = "Role", data= dataFrame, whis=np.inf)
sb.swarmplot(x = "Matches", y = "Role", data= dataFrame, color=".3")

# display
plt.show()
輸出
將產生以下輸出

更新於: 27-9 月-2021
214 檢視

廣告