
 資料結構
資料結構 網路
網路 RDBMS
RDBMS 作業系統
作業系統 Java
Java iOS
iOS HTML
HTML CSS
CSS Android
 Python
 C 程式設計
 C++
C++ C#
C# MongoDB
 MySQL
MySQL Javascript
 PHP
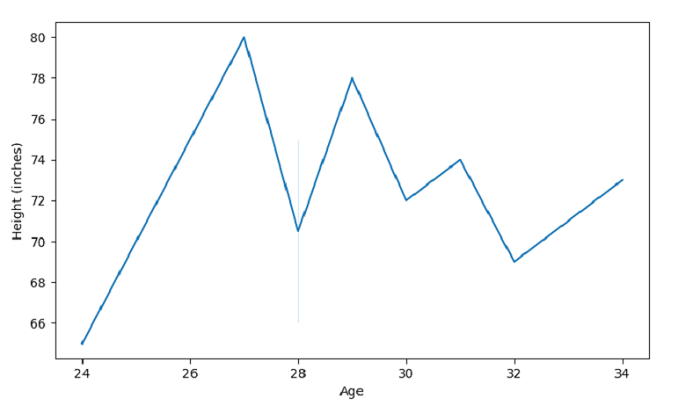
PHP使用 Seaborn 繪製線形圖 – Python Pandas
Seaborn 中的線形圖用於繪製線形圖,並具有多種語義分組的可能性。為此,使用了 seaborn.lineplot() 函式。
假設我們的資料集如下所示,以 CSV 檔案的形式存在 − Cricketers.csv
首先,匯入必需的 3 個庫 −
import seaborn as sb
import pandas as pd
import matplotlib.pyplot as plt
將資料從 CSV 檔案載入到 Pandas DataFrame −
dataFrame = pd.read_csv("C:\Users\amit_\Desktop\Cricketers.csv")
示例
程式碼如下所示 −
import seaborn as sb
import pandas as pd
import matplotlib.pyplot as plt

# Load data from a CSV file into a Pandas DataFrame
dataFrame = pd.read_csv("C:\Users\amit_\Desktop\Cricketers.csv")
print("\nReading the CSV file...\n",dataFrame)

# Age in kgs
x = dataFrame['Age']

# Height in Inches
y = dataFrame['Height']

# plot lineplot with Age and Height
sb.lineplot(x,y)
plt.ylabel("Height (inches)")
plt.show()
輸出
這將產生以下輸出 −

更新於: 2021 年 10 月 1 日
482 次瀏覽

廣告